.png)


CINE TEST CHART
- Introduction
- Product Software
CINE TEST CHART
REFLECTANCE
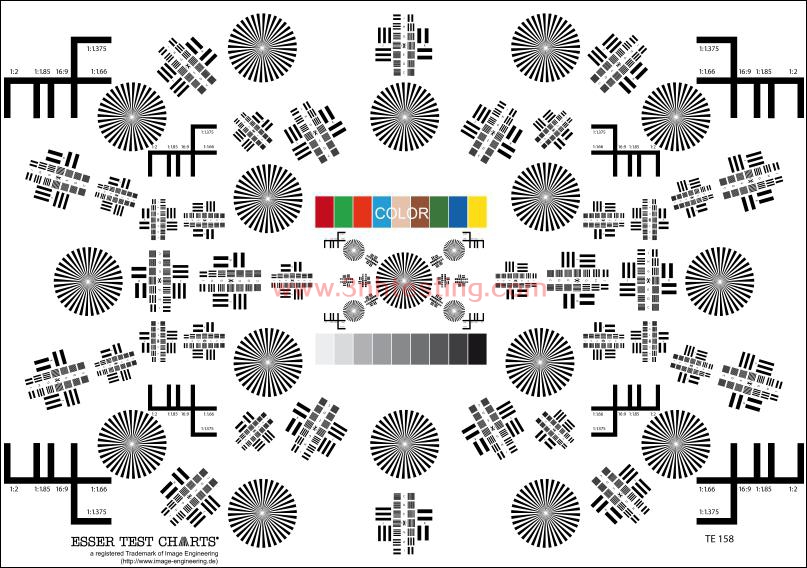
The test chart is designed for evaluating the image quality of film cameras. It can be used
for cameras of different formats. It has format markings for the following aspect ratios:
1:1.375 35mm 1:1.66 S16mm
16:9 PAL Plus / HDTV 1:1.85 1:2
There are markings for 3 different reductions:
related to 35 mm film 7.5x, 25x and 45x related to S16 80.5x, 44.5x and 13.4x
The image mounted on a stable 10mm plastic plate consists of different test elements as
described below:
A 16 sector stars with 36 sectors and an diameter of 80mm and 4 sector stars of
25mm diameter. The sector sta rs are used for focussing the camera and simple
visual appraisal of the lens tested.
B Test elements (TE142) as usually used in testing resolving power. The line sets,
two of each arranged at right angle are marked from C to K and graduated by factor
√2. That means that every two steps the number of lines is divided by two. There
are three different sizes of the test elements not only in accordance with the three
different resolution scales but also to provide a higher range of possible resolution
measurement. The resolutions according to the reduction scales and the field markings
are given in the table below.
C 9 testcolour patches to evaluate color reproduction of the film material. The color
partly corresponds to those of the Macbeth ColorChecker.
D A nine step linear gray scale (D = 0.2 - 1.8).
|
TE142 small |
|
resolving power in line pairs / mm with reduction factor |
|
|||||
|
field |
original |
7.5x |
|
25x |
45x |
13.4x |
|
80.5x |
|
C |
8.3 |
62 |
|
208 |
375 |
112 |
|
671 |
|
D |
5.9 |
44 |
|
147 |
265 |
79 |
|
473 |
|
E |
4.2 |
31 |
|
104 |
188 |
56 |
|
336 |
|
F |
3.0 |
22 |
|
73 |
133 |
40 |
|
238 |
|
G |
2.1 |
16 |
|
52 |
94 |
28 |
|
168 |
|
H |
1.5 |
11 |
|
37 |
66 |
20 |
|
118 |
|
I |
1.0 |
7.5 |
|
26 |
47 |
14 |
|
84 |
|
J |
0.75 |
5.6 |
|
19 |
33 |
10 |
|
60 |
|
K |
0.5 |
4 |
|
13 |
23.5 |
7 |
|
42 |
|
|
|
|
|
|||||
|
TE142 middle |
|
resolving power in line pairs / mm with reduction factor |
|
|||||
|
field |
original |
|
|
25x |
45x |
|
|
80.5x |
|
C |
2.7 |
|
|
68 |
122 |
|
|
219 |
|
D |
1.9 |
|
|
48 |
87 |
|
|
155 |
|
E |
1.4 |
|
|
34 |
61 |
|
|
109 |
|
F |
1.0 |
|
|
24 |
43 |
|
|
78 |
|
G |
0.7 |
|
|
17 |
31 |
|
|
55 |
|
H |
0.5 |
|
|
12 |
22 |
|
|
39 |
|
I |
0.34 |
|
|
8.5 |
15 |
|
|
27 |
|
J |
0.24 |
|
|
6 |
11 |
|
|
19 |
|
K |
0.17 |
|
|
4 |
8 |
|
|
14 |
|
|
|
|
|
|||||
|
TE142 large |
|
resolving power in line pairs / mm with reduction factor |
|
|||||
|
field |
original |
|
|
25x |
45x |
|
|
80.5x |
|
C |
1.8 |
|
|
45 |
81 |
|
|
146 |
|
D |
1.28 |
|
|
32 |
58 |
|
|
103 |
|
E |
0.9 |
|
|
23 |
41 |
|
|
73 |
|
F |
0.64 |
|
|
16 |
29 |
|
|
52 |
|
G |
0.45 |
|
|
11 |
20 |
|
|
36 |
|
H |
0.32 |
|
|
8 |
14 |
|
|
26 |
|
I |
0.23 |
|
|
6 |
10 |
|
|
19 |
|
J |
0.16 |
|
|
4 |
7 |
|
|
13 |
|
K |
0.1 |
|
|
2 |
4 |
|
|
8 |
|
|
|
|
|
|
|
|
|
|
News
- 2014-06-12 Color Fastness
- 2014-06-26 3nh TUV Certificate
- 2015-05-08 PANTONE CU Color Card (Electronic E ...
- 2014-06-12 Human Eyes to Distinguish Colors
- 2014-06-12 Pantone TPX 2012 (175 New Colors)
- 2015-05-08 3nh Products FCC Certificate
- 2014-06-26 3nh ROHS Certificate
- 2014-06-12 Integrating Sphere
