.png)


SINUSOIDAL MULTI BURST TEST CHART
- Introduction
- Product Software
SINUSOIDAL MULTI BURST TEST CHART
TRANSPARENCY
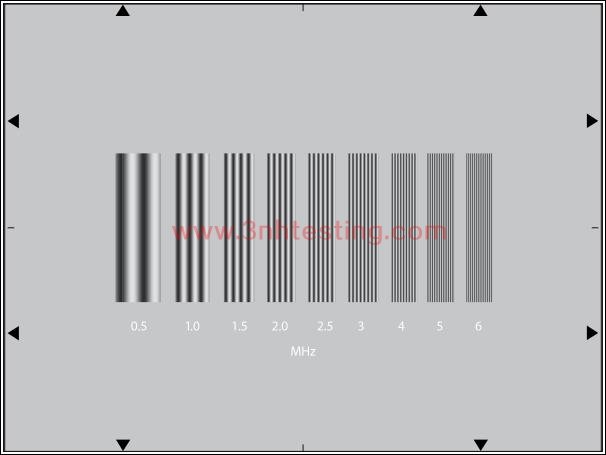
The test chart is designed for measuring horizontal static resolution. It shows vertical bars,
the density variation of which gives a sinusoidal video response. This is preferred to a
rectangular function test pattern, because this is in fact likely to create harmonic
frequencies which can impair resolution measurement owing to know „moirés“
phenomena in CCD Camera. The bars create frequencies of 0.5, 1, 1.5, 2, 2.5,
3, 4, 5, 6MHz.
Measuring equipment: Video oscilloscope or preferably videooscilloscope
with memory.
Shading correction: ON
Aperture correction: OFF
Gamma correction: OFF
Contour correction: OFF
Colour correction: OFF
Iris: F/5.6 for 2/3 '' CCD, F/4 for 1/2 '' CCD
The test chart is evenly illuminated so that for the low frequency burst at 0.5 MHz
the amplitude of the video signal at the output of the correctly positioned and
focussed camera is 0% (0V) for the black bars of the zebra-strip and 100%
(700 mV / 75 Ohms) for the white bars of the zebra-strip.
Care must be taken to avoid clipping of the signal to be measured at the black
and white level. Measurements can be made on the various camera output
signal, but preferably on the Y luminance signal (or coded Y with perfect B
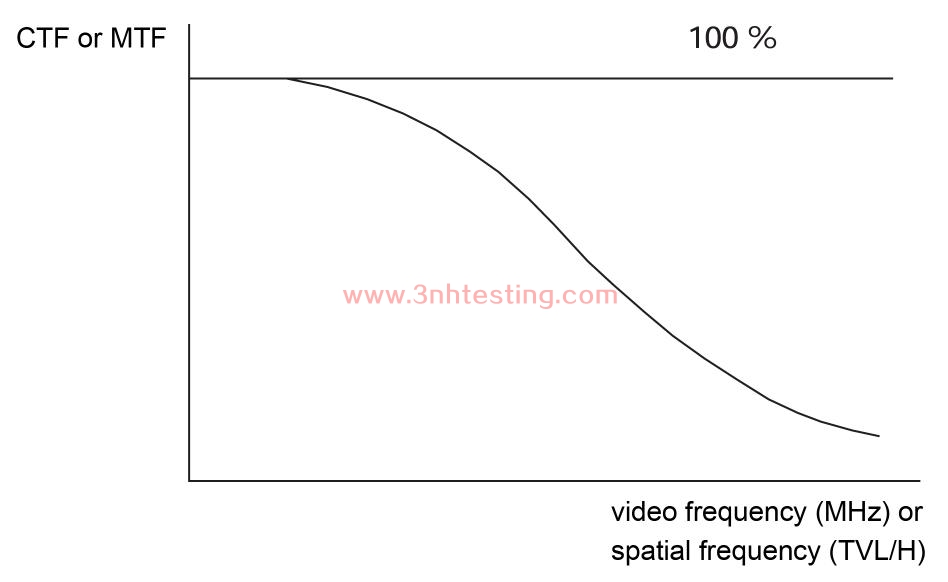
and W balance). The measurement give the contrast loss of the camera
response at the value of 5 MHz, the measurement of the response at other
frequency of the test chart. Frequency burst of 0.5, 2, 3, 5, and 6 MHz are
recommended for this measurement. The obtained response is a modulation
transfer function (MTF)
In the - probable - case of a beat affecting camera response for a given spatial
frequency, and under certain conditions only, the measured signal reassembles
an amplitude-modulated carrier signal, as shown in the following figure:
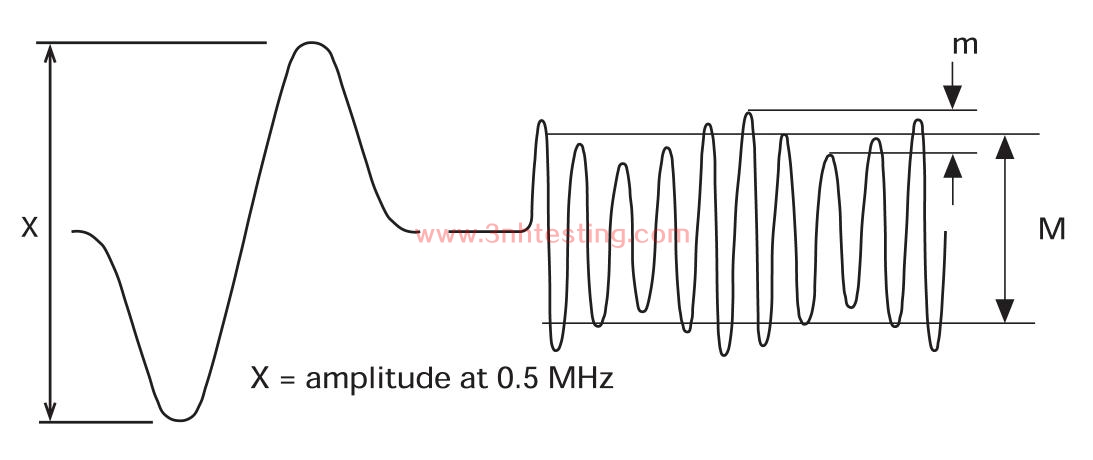
The percentage of modulation is then defined by the relation:
% mod = M / X
The interference ripple at this frequency is given by:
p %= m / M
This results of the measurement may be presented in the form of a table representing
the various areas of the imaging measured.
|
CTF value at 5 MHz |
|
|
|
xxx % |
xxx % |
xxx % |
|
xxx % |
xxx % |
xxx % |
|
xxx % |
xxx % |
xxx % |
- Previous:CINE TEST CHART
Next:LENS FOCUS TEST CHART
News
- 2014-06-26 3nh Products Have Got CE Certificat ...
- 2014-06-12 Pantone TPX 2012 (175 New Colors)
- 2024-03-08 New company name Guangdong ThreeNH ...
- 2015-05-08 PANTONE CU Color Card (Electronic E ...
- 2014-06-30 NS800 Spectrophotometer CE Certific ...
- 2014-06-12 Human Eyes to Distinguish Colors
- 2015-05-08 3nh Products FCC Certificate
- 2014-06-12 Colorimeters Versus Spectrophotomet ...
