GEOMETRY (BALL) TEST CHART 16:9
- Introduction
- Product Software
GEOMETRY (BALL) TEST CHART 16:9
REFLECTANCE

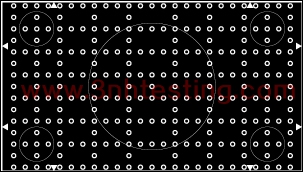
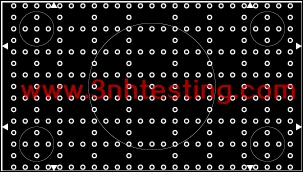
The test chart is designed to measure geometry of cameras and monitors.
In a black surrounding area bright circular rings are arranged as a grid in such a way that at ideal geometry their center points are located
in the intersection points of a 25/15 grid raster lines of electronic test generators. The division of the circular ring rasters is thus 40 lines
per total image. The small circular rings have an outer diameter of 3% and inner diameter of 1.5% of picture height. In addition there are
a large white circular line (diameter 75% of picture height) in the center of the image and 4 white circular lines in the image corners.
Utilization
For checking the geometry of cameras the test chart as shot by the camera has to be superimposed on the monitor with an electronically
generated grid of 15 horizontal and 25 vertical lines. The larger circular lines allow a rough visual appraisal of the geometry without using
an electronically generated grid.The test chart is also available in a positive version, black circular ring on a white background area.
Standards
• Pflichtenheft 8/1.1 der öffentlich-rechtlichen Rund funkanstalten der Bundesrepublik Deutschland “Richtlinien für die Messung der
Pflichtenheftsbedi ngungen an Videogeräten”
• IEC 611461-2 Video cameras (PAL/SECAM/NTSC) - Methods of Measurement - Part 2: Two- and three-sensor professional
cameras, 1997
• EN 50132-2-1 CCTV surveillance systems for the use in security applications
- Previous:COLOR CAMERA GRAY SCALE TEST CHART
Next:BAR TEST CHART
News
- 2014-06-12 CIE Standard Observers
- 2014-06-12 What is a colorimeter?
- 2024-04-29 New Guangdong ThreeNH bank account
- 2017-03-31 sales elite awards n the first quar ...
- 2017-11-08 Attention before using T90-7 camera ...
- 2014-06-26 3nh ISO9001 Certificate
- 2014-06-12 ISO 12233 RESOLUTION TEST CHART
- 2015-05-08 3nh Products FCC Certificate
.png)


.jpg)
.jpg)
.jpg)

