.png)


BAR TEST CHART
- Introduction
- Product Software
BAR TEST CHART 16:9
REFLECTANCE
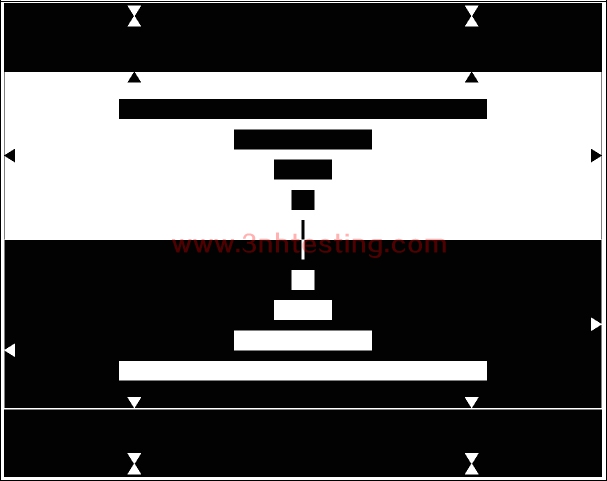
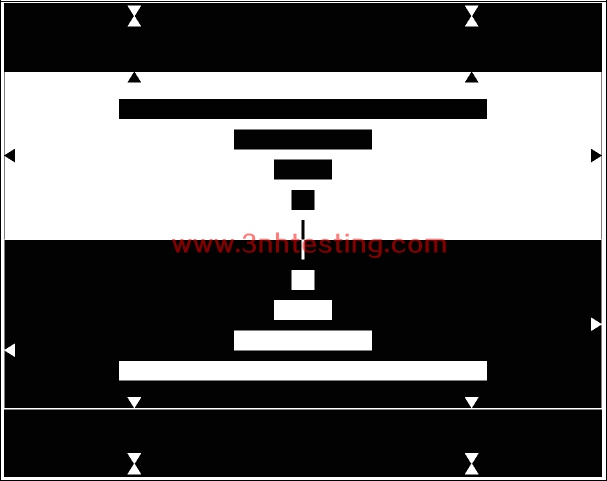
The bar test chart is designed for checking the transmission characteristics of TV cameras at intermediate and deep frequencies.
In the upper part of the picture 4 black horizontal bars of different length are arranged in a white surrounding. The lower part is a
mirror image to be upper one; however white bars are arranged in a black surrounding. A narrow vertical strip of black and white
each are located in the center of the picture. These strips resp. bars generate puls signals of approx. 2 µs, 5 µs, 12 µs and 32 µs.
Utilization
Inadequate transmission characteristics at intermediate and deep frequencies generate streaking effects in scanning line direction. Streaking may also be caused by defective clamping circuits. Long streaking (high error-time-constancy) are clearly visible at the monitor. Short streaking (low error-time-constancy) can be better observed in the oscillogram. For this purpose an oscilloscope with a line selector has to be used and the different bars may be observed one after the other. Also the adjustment of streaking (e.g. compensation of afterglow of flying spot scanners) should be effected with the aid of picture monitor and oscilloscope.
The narrow vertical strips in the center of the picture show echo disturbances, as may occur e.g. with defective delay lines in circuits for aperture corrections. The large black and white areas in both parts of the picture are designed to asses shadings, background structure and other errors. For this purpose the test chart may also be used upside down.
Standards
• Pflichtenheft 8/1.1 der öffentlichen-rechtlichen Rundfunkanstalten der Bundesrepublik Deutschland “Richtlinien für die Messung der Pflichtenheftsbedingungen an Videogeräten”
• IEC 611461- 2 Video cameras (PAL/SECAM/NTSC)- Methods of Measurement - Part 2: Two- and three-sensor professional cameras, 1997.
- Previous:GEOMETRY (BALL) TEST CHART 16:9
Next:UNIVERSAL TEST CHART
News
- 2014-06-12 Colorimeters Versus Spectrophotomet ...
- 2024-03-08 New company name Guangdong ThreeNH ...
- 2017-03-31 sales elite awards n the first quar ...
- 2014-06-12 NH Series High-Quality Colorimeter
- 2015-05-08 3nh Products FCC Certificate
- 2014-06-12 3nh Innovation from Products to Mar ...
- 2014-06-12 ISO 12233 RESOLUTION TEST CHART
- 2014-06-26 3nh Products Have Got CE Certificat ...
