COLOR CAMERA GRAY SCALE TEST CHART
- Introduction
- Product Software
COLOR CAMERA GRAY SCALE TEST CHART
REFLECTANCE
.jpg)
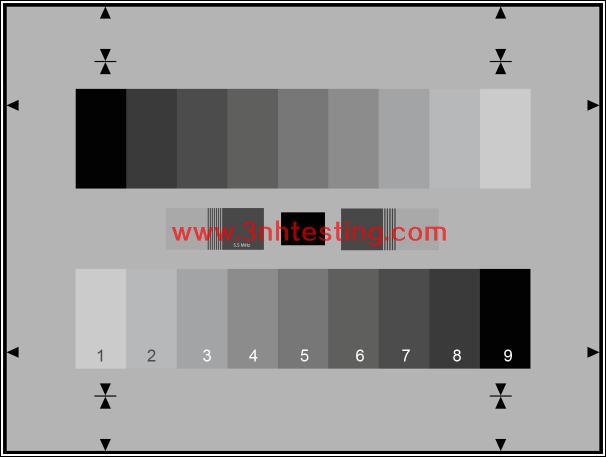
Two 9-graduated counter current gray scales are arranged on a gray background (D ≈ 0.75), the gray scales being graduated
logarithmically(gamma = 0.45). The output of an optimally gamma-corrected camera yields two 9-graduated counter current linear
step signals. The contrast range of the gray scales is 50:1.
The values of the 9-graduated gray scale are as follows:
|
Step |
Density |
Remission in % |
Output voltage in % |
|
1 |
0.22 |
60 |
100 |
|
2 |
0.32 |
48 |
88.75 |
|
3 |
0.44 |
36 |
77.5 |
|
4 |
0.57 |
26 |
66.25 |
|
5 |
0.73 |
19 |
55 |
|
6 |
0.91 |
12 |
43.75 |
|
7 |
1.13 |
07 |
32.5 |
|
8 |
1.43 |
04 |
21.25 |
|
9 |
1.85 |
01.4 |
10 |
The density values are based on a density of BaO4S= 0.
The test chart incorporates a super black cavity for the accurate adjustment of camera flare corrections and setting of black level.
On both sides of the super black hole 4.5 and 5.5MHz bars with a contrast ratio of 7:1 are located. Above and below the gray
scales there are additional markings for the 16:9 format.
News
- 2014-06-12 Colorimeters Versus Spectrophotomet ...
- 2014-06-26 3nh ROHS Certificate
- 2014-06-26 3nh TUV Certificate
- 2014-06-26 3nh ISO9001 Certificate
- 2017-03-31 sales elite awards n the first quar ...
- 2017-06-27 Definition and formation of pixel n ...
- 2024-04-29 New Guangdong ThreeNH bank account
- 2014-06-12 Color Fastness
.png)


.jpg)
.jpg)
.jpg)

