.png)

Recommend Products


Contact Us
Address: 6-8/F,Building B33,Low-Carbon Headquarters Park,400 Xincheng Avenue,Zengcheng District,Guangzhou,P.R.China.
Service Hotline: 400-666-2522
Tel: +86 13510845302
Whatsapp:13510845302
wechat:13510845302/Li_3nh
Email:sales0026@3nh.com
QQ: 2976464251
Skype: +8613510845302
Website: www.3nhtesting.com

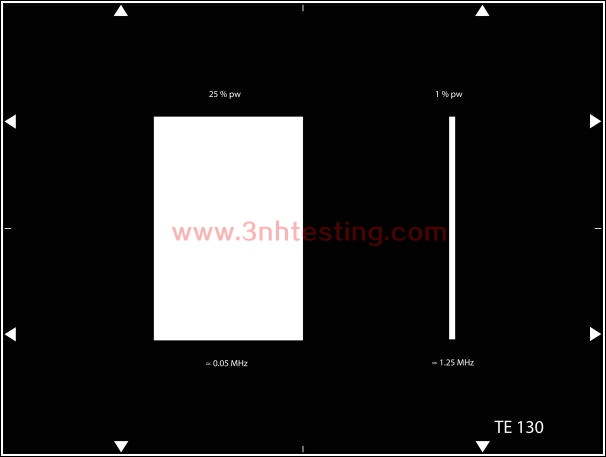
WHITE PULSE TEST CHART
The test chart is used to measure low and intermediate frequency response (streaking) and
flare in video systems.
Date:2017-07-24 Browse:
- Introduction
- Product Software
WHITE PULSE TEST CHART
REFLECTANCE
The test chart is used to measure low and intermediate frequency response (streaking) and
flare in video systems.
The background has a density of > 1.9 (remission < 0,1%). The transparent rectangle has a
width equal to 25% of picture width (approx. 0.05 MHz).
In addition the chart shows a narrow white pulse, width equal to 1% picture width
(approx. 1.25 MHz). The transmission of the white picture area is 70% (density ~ 0.1)
News
- 2014-06-26 3nh Products Have Got CE Certificat ...
- 2014-06-12 Colorimeters Versus Spectrophotomet ...
- 2014-06-12 Human Eyes to Distinguish Colors
- 2017-03-31 sales elite awards n the first quar ...
- 2014-06-12 CIE Standard Observers
- 2015-05-08 PANTONE CU Color Card (Electronic E ...
- 2014-06-12 What is a colorimeter?
- 2024-04-29 New Guangdong ThreeNH bank account
