.png)

Recommend Products


Contact Us
Address: 6-8/F,Building B33,Low-Carbon Headquarters Park,400 Xincheng Avenue,Zengcheng District,Guangzhou,P.R.China.
Service Hotline: 400-666-2522
Tel: +86 13510845302
Whatsapp:13510845302
wechat:13510845302/Li_3nh
Email:sales0026@3nh.com
QQ: 2976464251
Skype: +8613510845302
Website: www.3nhtesting.com

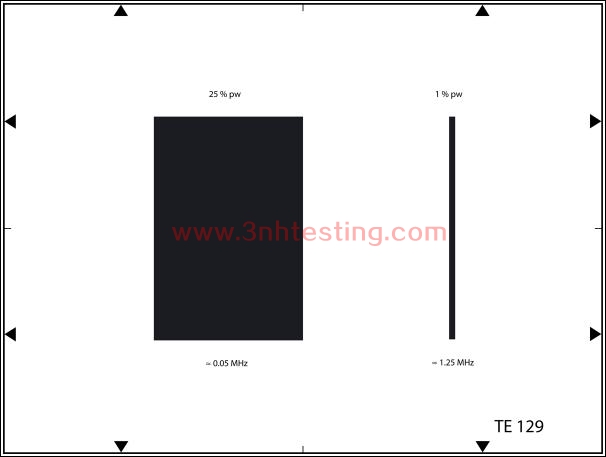
BLACK PULSE TEST CHART
The test chart is used to measure low and intermediate frequency response (streaking) and flare in video systems.
Date:2017-07-24 Browse:
- Introduction
- Product Software
BLACK PULSE TEST CHART
REFLECTANCE
The test chart is used to measure low and intermediate frequency response (streaking) and
flare in video systems.
The white background has a density of ~ 0.15 . The black rectangle has a width equal to
25% of picture width (approx. 0.05 MHz). In addition the chart shows a narrow black pulse,
width equal to 1% picture width (approx. 1.25 MHz). The density of the black picture area is
D > 1.9 (remission < 0,1%).
- Previous:ITE HIGH RESOLUTION CHART 16:9
Next:WHITE PULSE TEST CHART
News
- 2014-06-26 3nh TUV Certificate
- 2014-06-12 Pantone TPX 2012 (175 New Colors)
- 2017-11-08 Attention before using T90-7 camera ...
- 2014-06-12 CIE Standard Observers
- 2014-06-12 What is a colorimeter?
- 2017-06-27 Definition and formation of pixel n ...
- 2014-06-12 Color Fastness
- 2014-06-30 NS800 Spectrophotometer CE Certific ...
