.png)


FULL FIELD RED TEST CHART
- Introduction
- Product Software
FULL FIELD RED TEST CHART
TRANSPARENCY

The test chart is designed for measuring the behaviour of the chrominance channel expressed
as the signal-to-noise ratio. The equipement has to be arranged as shown in Fig. 1.
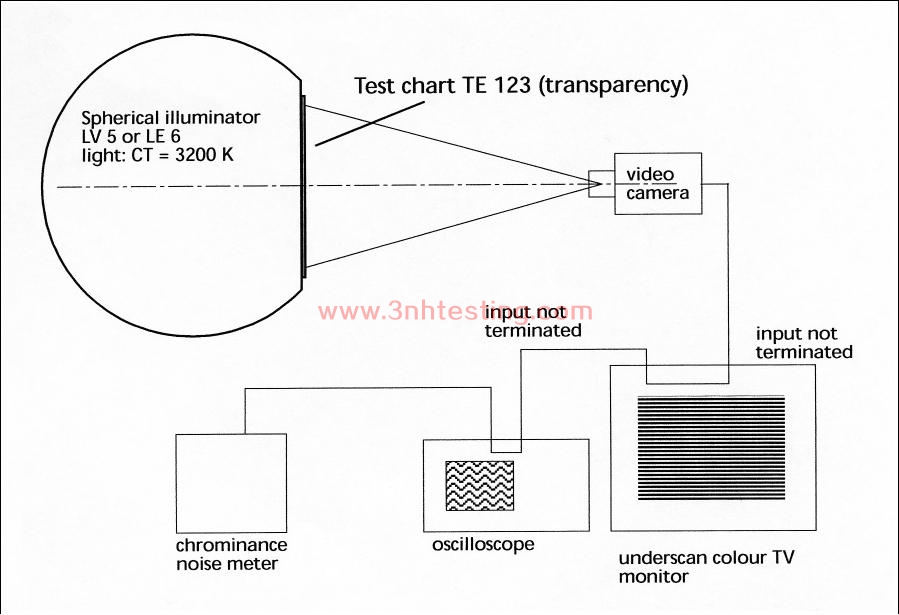
Fig. 1
Conditions of shooting
• The luminance of a transparent test chart, at peak white, shall be 636 cd/m² +/- 5%
(= 2000lx)
• The white balance shall be set manually or autmatically to 3200K +/- 100 K
• The test chart shall be shot by the camera so that the frame limited by the arrows
exactly coincides with the edges of the picture displayed on the video monitor in
underscan mode
• The camera shall be adjusted out of focus
• Gain control shall be set to "0 dB" gain
• Optical filter shall be set to "open position"
The AM chrominance signal-to-noise ratio and the PM chrominance signal-to-noise ratio
shall be measured as follows. The method applies to NTSC and PAL color video signals.
The chrominance signal-to-noise ratio (S/N) is separated into amplitud-modulated (AM)
chrominance S/N ratio (ratio of reference signal level to amplitude-modulated noise
component) and phase-modulated (PM) chrominance S/N ratio (ratio reference signal
level to phase-modulated noise component). The reference signal is the voltage (Vref)
of the chrominance signal to 100% amplitude of the non-composite video signal.
Each ratio is defined as follows
AM chrominance S/N = 20 lg (Vref(p-p)) / (AM noise r.m.s.)
PM chrominance S/N = 20 lg (Vref(p-p)) / (PM noise r.m.s.)
where:
Vref (p- p) = chrominance voltage corresponding to 100% amplitude on non-composite video
signal
AM noise r.m.s. = r.m.s. voltage of the amplitude-modulated component of the
noise in the chrominance band width.
PM noise r.m.s. = r.m.s. voltage of the phase- modulated component of the
noise in the chrominance band width
The AM and PM noise indications shall be isolated from the influence of PM and AM noise,
respectively, by 30dB minimum. The AM detector shall be an averaging detector type that
measures power in the AM sidebands.
Chrominance noise measurement circuit
Fig. 2 shows a typical circuit configuration for the measurement of the chrominance noise.
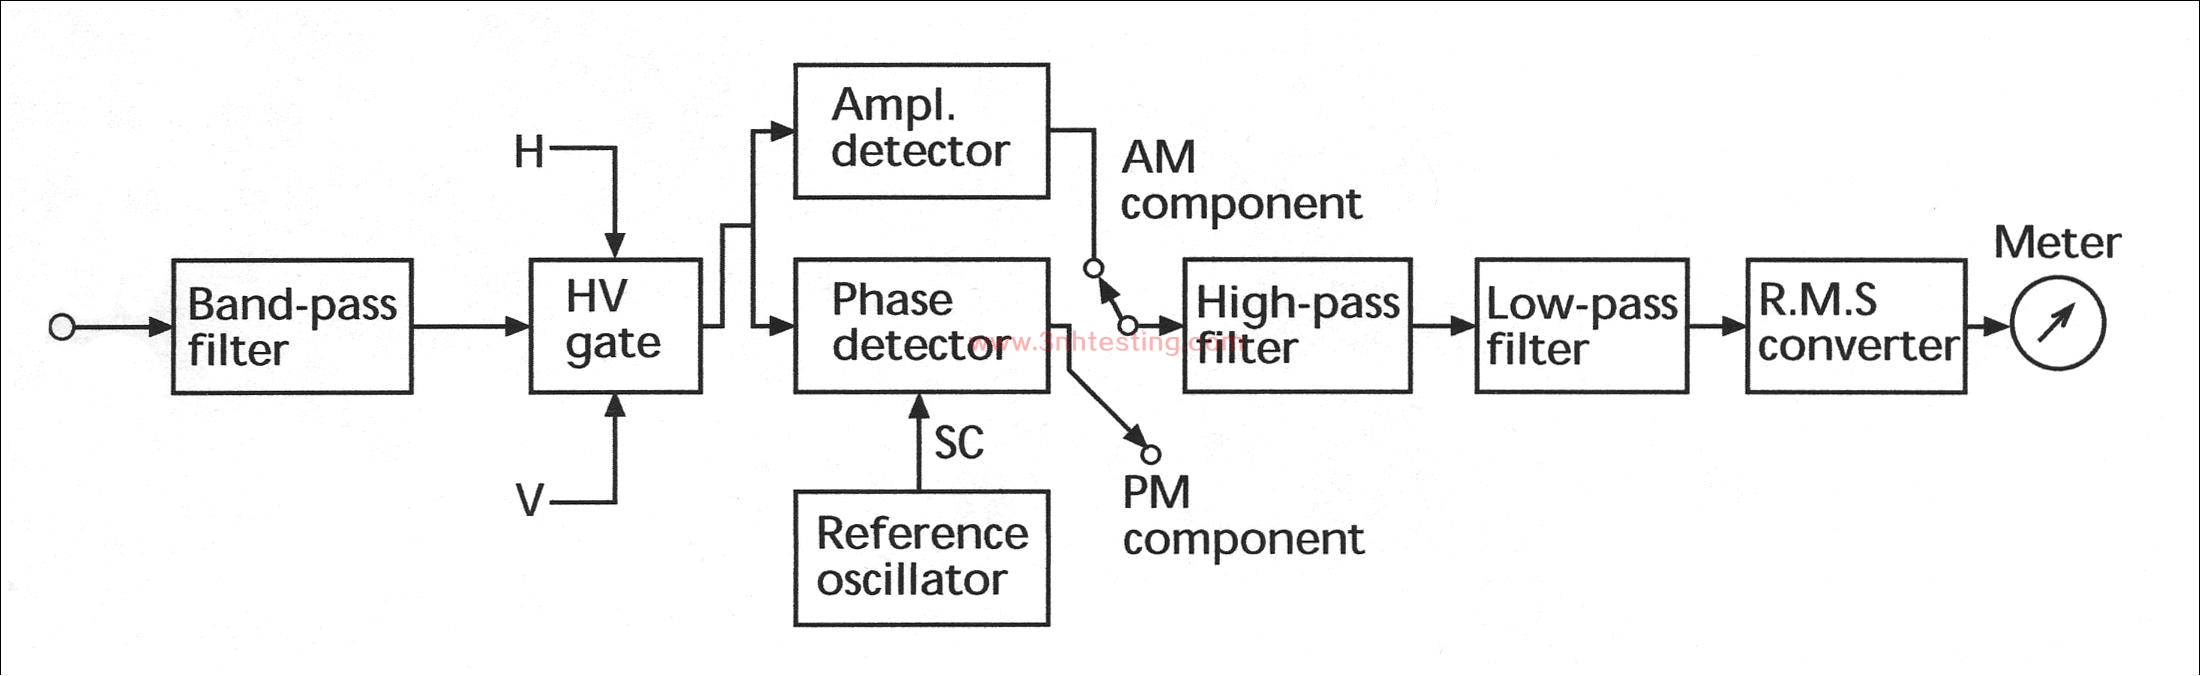
Fig. 2
The noise measuring apparatus shall contain electronic gatin circuits capable of excluding
horizontal (H) and vertical (V) blanking intervals from the voltmeter. The duty cycle shall be
such as to essentially measure the entire television field. Suitable compensation for the duty
cycle of the gating process shall be incorporated in the apparatus to ensure accuracy.
The changes in the color subcarrier are separated into amplitude and phase components and
are measured. The color burst shall not be employed as reference for the phase detection since
there is no direct relationship to the picture contents due to the frequently used separate
processing of the burst.
The demodulated signals are then band-limited by the high-pass and low-pass filters to
achieve the overall measuring system having cut-off frequencies as indicated below. The
components are converted into r.m.s. voltage by the r.m.s. converter and the value is indicated
with the meter.
The ratio between the noise voltage (V ms) and the reference (Vref(p-p)) is expressed in
decibles. The PM detector in the PAL system is designed so that it is capable of detecting
the disturbance components created when the phase is switched to coincide with the PAL phase.
High-pass fc100 Hz, 1 kHz, 10 kHz, 100 kHz
Low-pass fc100 kHz, 500 kHz, 1 MHz
- Previous:CCD REGISTRATION TEST CHART
Next:HDTV RESOLUTION TEST CHART
News
- 2017-03-31 sales elite awards n the first quar ...
- 2015-05-08 PANTONE CU Color Card (Electronic E ...
- 2014-06-12 ISO 12233 RESOLUTION TEST CHART
- 2014-06-12 Integrating Sphere
- 2014-06-12 What is a colorimeter?
- 2014-06-12 Pantone TPX 2012 (175 New Colors)
- 2014-06-12 3nh Innovation from Products to Mar ...
- 2017-11-08 Attention before using T90-7 camera ...
