.png)


HDTV RESOLUTION TEST CHART
- Introduction
- Product Software
HDTV RESOLUTION TEST CHART 16:9
REFLECTANCE
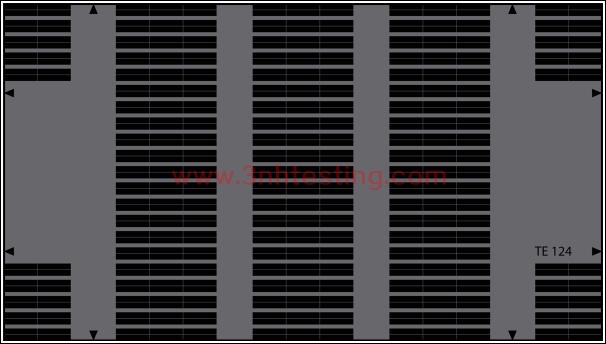
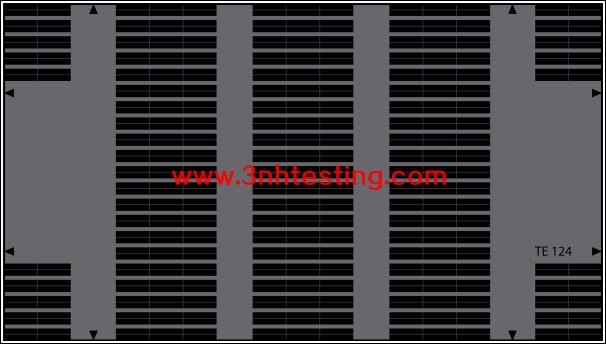
The test chart with an aspect ratio of 16:9 shows in the middle area 9 blocks containing 42
resolution patterns each. The corner fields have 20 resolution patterns.
The resolution patterns are arranged in such a way that the local frequency of x and y have a
full 100 cph. Therefore, for any pattern with y ≠ 0 the resolution lines have a different angle.
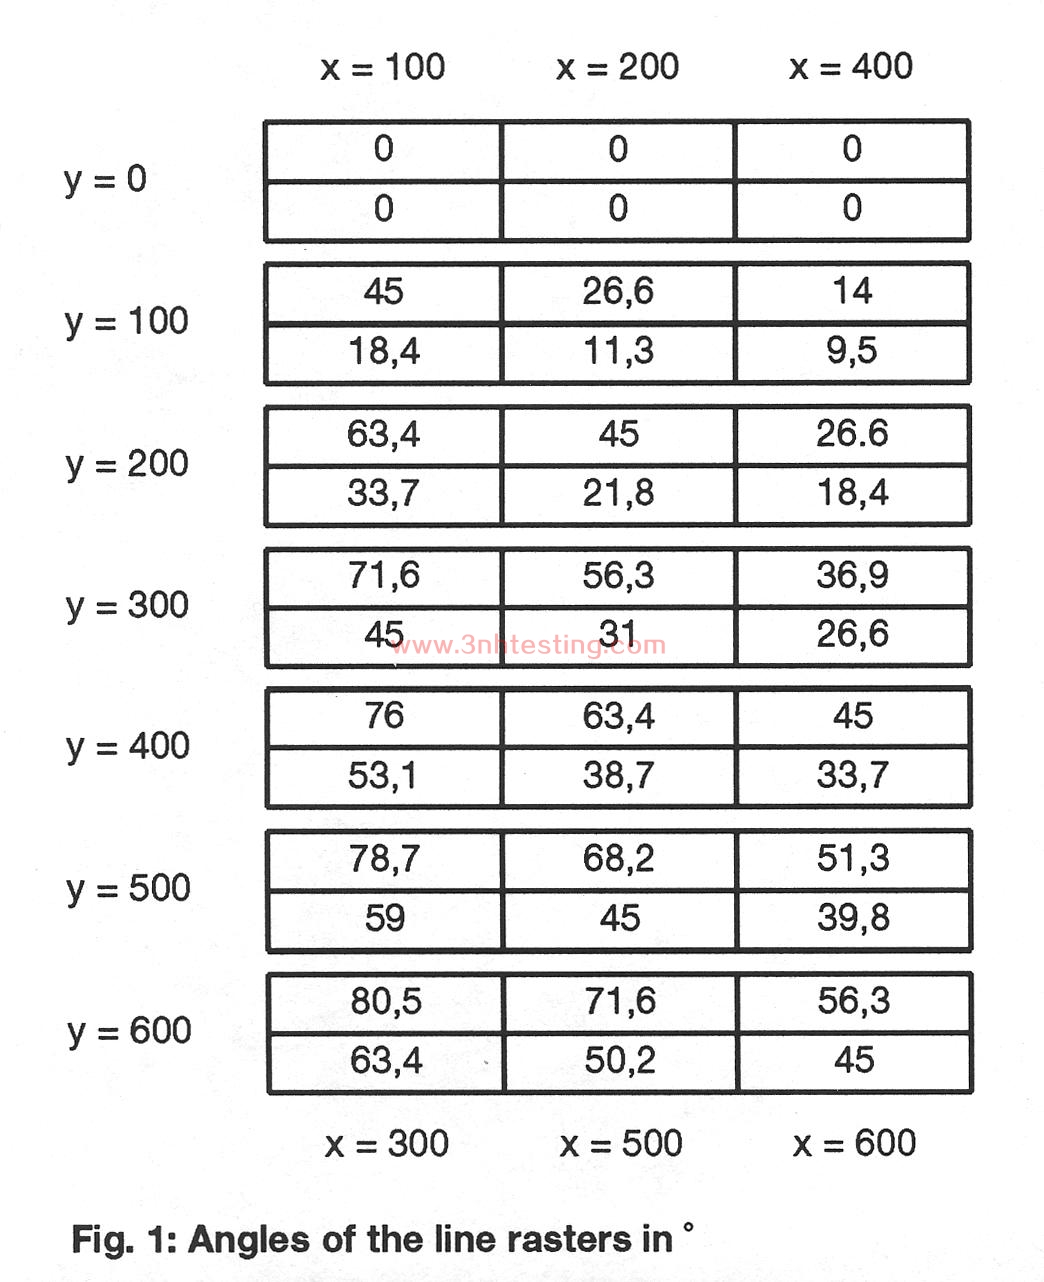
The angle of each pattern is indicated in fig.1. The angles of the lower and the central block
were rotated by 90° compared with the remaining blocks.
Frequencies are indicated in cph (cycles per height). For a better survey frequencies are
indicated only for the 4 outer and 5 of the inner blocks. x is indicated only for two of the 7 (5)
pattern rows. The indication for x = 100, 200 and 400 is above and the indication for x = 300,
500 and 600 is below the respective resolution pattern.
The test chart is particularly suited for measurements by oscilloscopes. Measurements with
a frequency analyser cause further efforts, which are not described in detail in this paper.
The oscilloscope has to be triggered to a determine line. The position of this line within the
chart determines the local frequency. This is easier, if the selected line can be unblanked
on the monitor, as is usual for camera control units. The great advantage of this test chart
is to have many periods of the same frequency, which enables a more precise measurement.
Using a digital storage oscilloscope, noise reduction is possible but also a Fourier transformation
of the burst, which results from a resolution pattern.
The modulation transfer function of a camera can be defined with the TE124 test chart at
13 x 6 test points (s.fig. 2), whereby the highest frequencies in general will not be resolved.
A resolution pattern with only horizontal lines is deliberately left out because of the difficulty
to measure such a pattern within the TV-line structure. The modulation transfer function is
symmetrical to point (therefore in fig. 2 every test point is shown twice), but for valve
cameras the MTF is not symmetrical to the axis, therefore the line patterns were laid both
diagonal directions. To define both parts of the MTF on the sam spot within the chart
area, the test chart may be rotated by 180°. Thereby the diagonal direction changes in the
resolution patterns. For measurement in the corner fields a reduced number of resolution
patterns is available.
The grouping of the resolution patters within a six pattern block was chosen with respect
to the uneven harmonic. This is an advantage with evaluations by Fourier transformations
or with a frequency analyser.
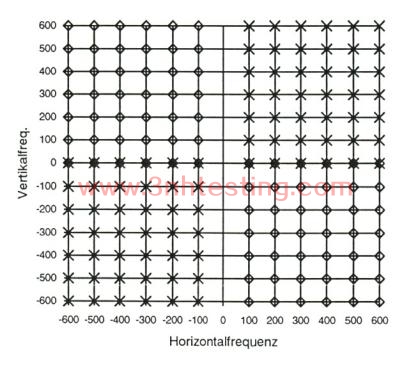
Fig. 2: Measuring points on the local frequency level
X: line raster with / - direction
◊: line raster with \ - direction
- Previous:FULL FIELD RED TEST CHART
Next:HDTV ZONE PLATE TEST CHART
News
- 2014-06-12 Pantone TPX 2012 (175 New Colors)
- 2014-06-12 Integrating Sphere
- 2014-06-12 Human Eyes to Distinguish Colors
- 2014-06-26 3nh TUV Certificate
- 2017-03-31 sales elite awards n the first quar ...
- 2014-06-12 The Color of Objects
- 2014-06-30 NS800 Spectrophotometer CE Certific ...
- 2014-06-12 What is a colorimeter?
