.png)

Recommend Products
.jpg)
.jpg)
.jpg)
.jpg)
.jpg)
Contact Us
Address: 6-8/F,Building B33,Low-Carbon Headquarters Park,400 Xincheng Avenue,Zengcheng District,Guangzhou,P.R.China.
Service Hotline: 400-666-2522
Tel: +86 13510845302
Whatsapp:13510845302
wechat:13510845302/Li_3nh
Email:sales0026@3nh.com
QQ: 2976464251
Skype: +8613510845302
Website: www.3nhtesting.com
You Are Here : Home >> Products >> Image test chart >> Distortion Test Chart
>> 19 / 14 – GRID TEST CHART
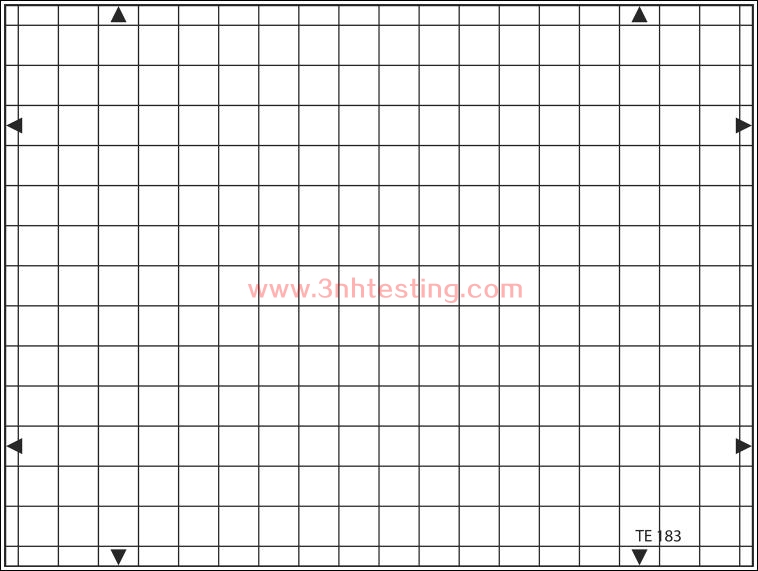
19 / 14 – GRID TEST CHART
A grid structure of 14 horizontal and 19 vertical lines is arranged on a white background.
Date:2017-08-24 Browse:
- Introduction
- Product Software
19 / 14 – GRID TEST CHART
REFLECTANCE
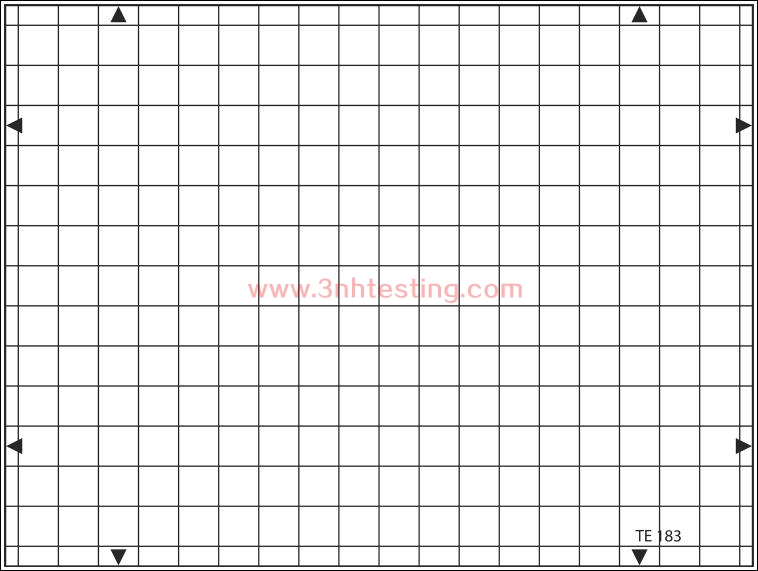
A grid structure of 14 horizontal and 19 vertical lines is arranged on a white background.
The grid corresponds to a grid generated electronically by a test generator. The grid
structure also corresponds to the ball structure of the T01 Geometry Test Chart.
UTILIZATION
The test chart is designed for operational adjustment and control of TV cameras. The
grid permits rough visual appraisal of scan linearity and the lines serve the purpose
of adjusting registration.
The chart is available also with white lines on a black background.
News
- 2015-05-08 3nh Products FCC Certificate
- 2014-06-12 CIE Standard Observers
- 2014-06-26 3nh ROHS Certificate
- 2014-06-12 NH Series High-Quality Colorimeter
- 2017-07-08 How to use SFR resolution test char ...
- 2017-11-08 Attention before using T90-7 camera ...
- 2014-06-12 What is a colorimeter?
- 2017-03-31 sales elite awards n the first quar ...
