.png)


CINE RESOLUTION TEST CHART
- Introduction
- Product Software
CINE RESOLUTION TEST CHART
REFLECTANCE
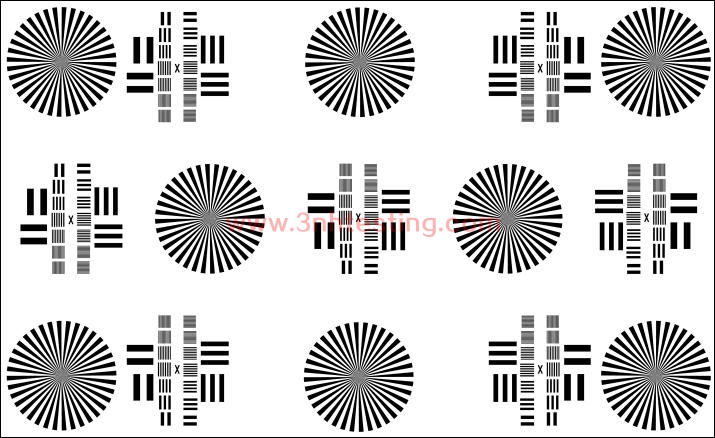
The test chart is used for evaluating the resolving power of a cine camera.
For this purpose the chart is set at a distance of the x-fold of the focal length to the centre
of the lens. The x-fold of the focal length corresponds to the reduction scale. The following
diagram shows the reduction scale 25, 50, 100, 200, 400 and 800. The resolution is indicated
in line pairs/mm, actually for each of the fields marked C to K.
|
|
|
|
line pairs / mm with reduction scale |
|
|
|||
|
field |
25 |
50 |
|
100 |
200 |
|
400 |
800 |
|
C |
59.1 |
118.2 |
|
236.4 |
472.8 |
|
945.6 |
1891.2 |
|
D |
41.8 |
83.6 |
|
167.2 |
334.4 |
|
668.8 |
1337.6 |
|
E |
29.6 |
59.1 |
|
118.2 |
236.4 |
|
472.8 |
045.6 |
|
F |
20.9 |
41.8 |
|
83.6 |
167.2 |
|
334.4 |
668.8 |
|
G |
14.8 |
29.6 |
|
59.1 |
118.2 |
|
236.4 |
472.8 |
|
H |
10.5 |
20.9 |
|
41.8 |
83.6 |
|
167.2 |
334.4 |
|
I |
7.4 |
14.8 |
|
29.6 |
59.1 |
|
118.2 |
236.4 |
|
J |
5.2 |
10.5 |
|
20.9 |
41.8 |
|
83.6 |
167.2 |
|
K |
3.7 |
7.4 |
|
14.8 |
29.6 |
|
59.1 |
118.2 |
- Previous:LINE PAIRS PER CM
Next:CINE STANDARD
News
- 2014-06-12 The Color of Objects
- 2014-06-12 Human Eyes to Distinguish Colors
- 2014-06-12 Pantone TPX 2012 (175 New Colors)
- 2014-06-30 NS800 Spectrophotometer CE Certific ...
- 2014-06-12 Color Fastness
- 2014-06-12 CIE Standard Observers
- 2024-03-08 New company name Guangdong ThreeNH ...
- 2017-11-08 Attention before using T90-7 camera ...
