.png)


CHROMINANCE RESOLUTION TEST CHART
- Introduction
- Product Software
CHROMINANCE RESOLUTION TEST CHART
REFLECTANCE

The test chart is designed to measure the amplitude frequency response of the
chrominance channels.
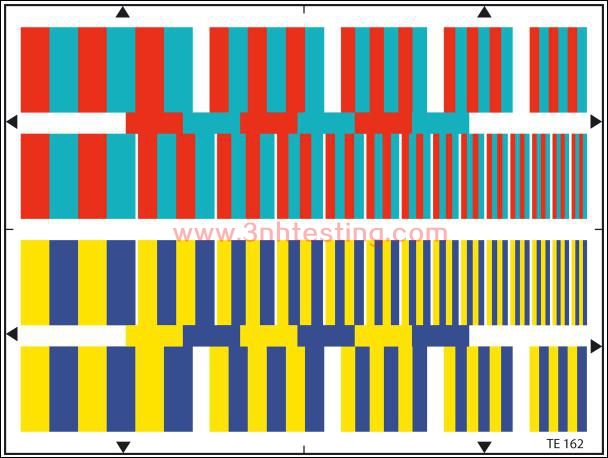
The measuring equipment shall be arranged as shown in figure 2. The test chart is a
color multi-burst pattern, covering a spatial frequency range from 100 kHz to 1.5 MHz.
The chart is composed of vertical bars whose colors are red and cyan in the upper half
of the picture area and yellow and blue in the lower half.
The conditions of shooting shall be as follows
A The illumination of the reflectance test chart shall be 2000 lx +/- 5%; the light
density of the transparency version shall be 636 cd/m² +/- 5% at peak white.
B The uniformity of the chart illumination shall be better than 95%.
C The correlated color temperature of the light source shall be 3100 K +/- 100 K.
The white balance shall be set manually or automatically to 3100 K +/- 100 K.
D The test chart shall be shot by the camera so that the frame limited by the arrows
exactly conicides with the edges of the picture displayed on the monitor in
underscan mode.
E The focus control shall be in auto or manual mode and shall be in best focus. The
iris control shall be in auto or manual mode.
F Gain control shall be set to “0 dB”.
G Optical filter if any shall be set to “open” position.
The color difference signals, EB-Y and ER-Y of the demodulator shall be measured bay
an oscilloscope. The peak-to-peak amplitude of the signal of each channel shall be
measured over the range of frequencies.
a) For E'R-Y output, the upper half of the active field, red and cyan bars, shall be used.
First, the upper middle line shall be selected and measured for spatial frequency of
100 kHz, then a line corresponding to the range of frequencies shall be selected for
multi-burst spatial frequencies.
b) For E'B-Y output, the lower half of the active field, yellow and blue bars, shall be
used. First, the middle line shall be selected and measured for spatial frequency of
100 kHz, then a line corresponding to the range of frequencies shall be selected for
multi-burst spatial frequencies.
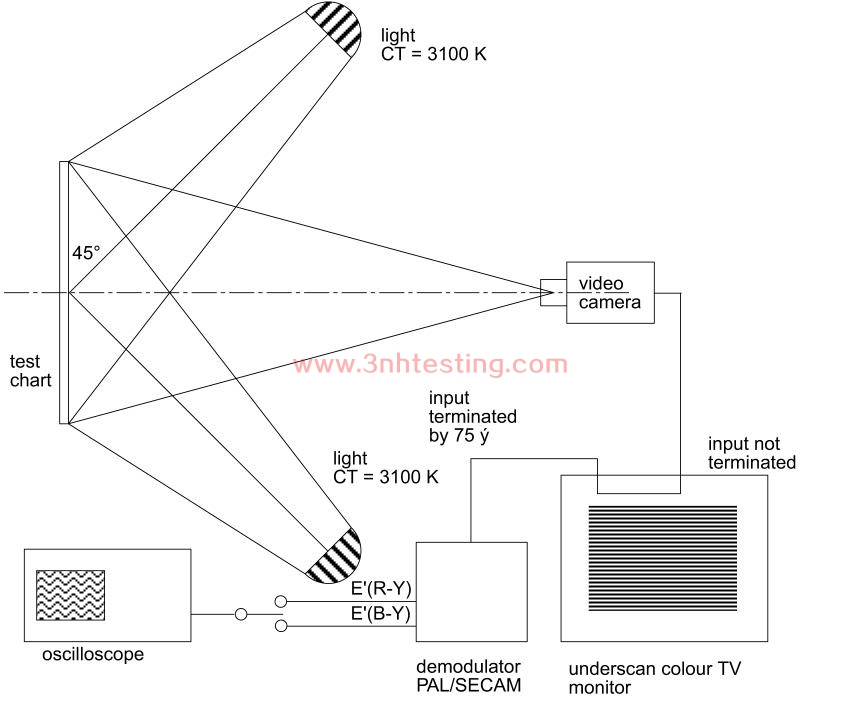
figure 2
Presentation of the results
Let E'R-Y100 and E'B-Y100 be the measured amplitudes of the respective channels at
spatial frequency of 100 kHz. The -3dB spatial frequency for the E'R-Y and E'B-Y
channels, determined by interpolation shall be reported taking E'R-Y100 and E'B-Y100
level (100 = 100 kHz) as references, respectively as follows:
FR-Y = _____________________________ kHz
FB-Y = _____________________________kHz
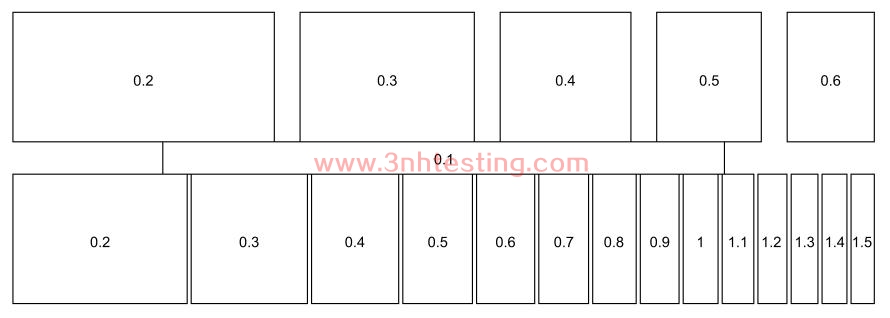
The arrangement of the spatial frequencies in MHz on the test chart is as follows
(upper and lower half are the same):
- Previous:LENS FOCUS TEST CHART
Next:BLACK AND WHITE CONTRAST TEST CHART
News
- 2014-06-12 ISO 12233 RESOLUTION TEST CHART
- 2014-06-26 3nh ISO9001 Certificate
- 2014-06-12 Integrating Sphere
- 2014-06-26 3nh Products Have Got CE Certificat ...
- 2014-06-12 Colorimeters Versus Spectrophotomet ...
- 2014-06-12 The Color of Objects
- 2017-03-31 sales elite awards n the first quar ...
- 2014-06-26 3nh TUV Certificate
