.png)


.jpg)
WINDOW TEST CHART 1%
- Introduction
- Product Software
WINDOW TEST CHART 1%
REFLECTANCE
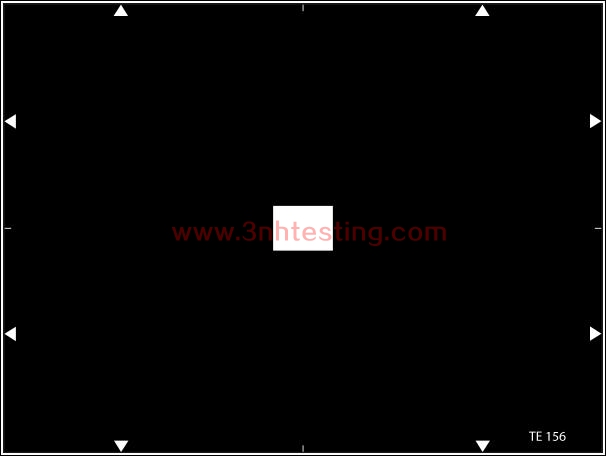
The test chart is designed to measure blooming and smearing effects of CCD cameras.
The transparency consists of a black area (density > 3.0) with a white (transparent) area
(density incl. glass planes ca 0.15). The transparent area has 1% of the picture area,
marked by the white arrows.
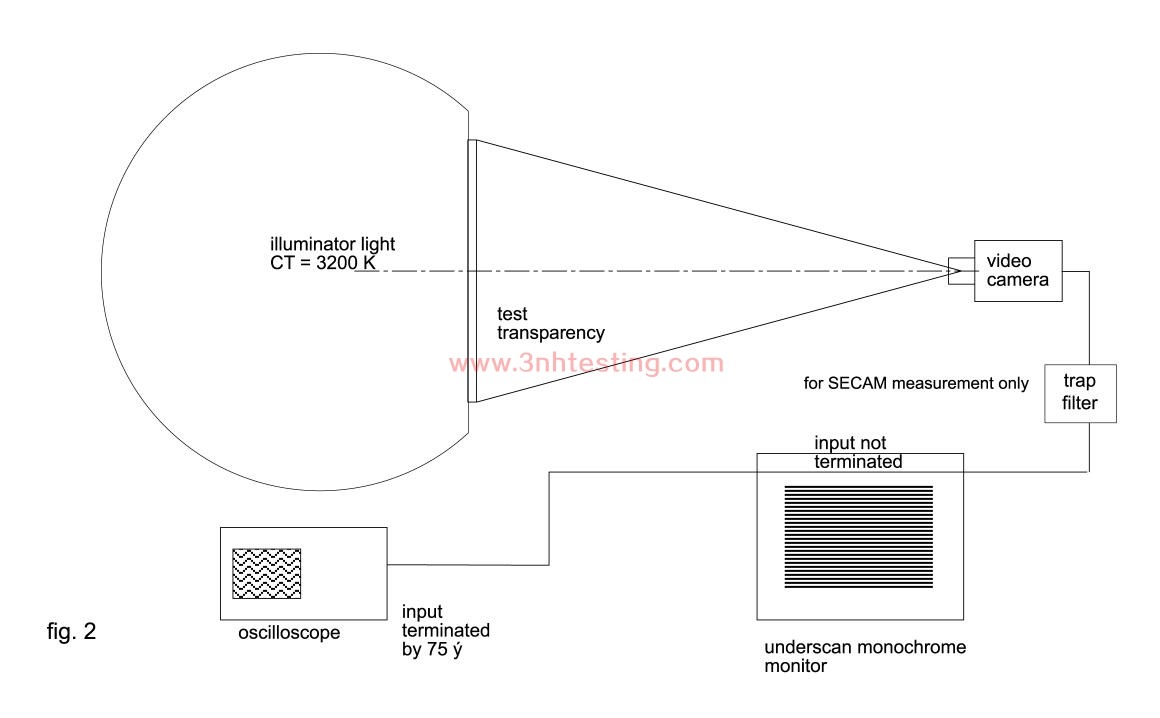
The measuring equipment shall be arranged as shown in fig. 2.
The conditions shooting shall be as the follows
A The light density of the transparency version shall be 636 cd/m² +/- 5% (= 2000lx) at
peak white.
B The correlated colour temperature of the light source shall be 3200 K +/- 100K. The
white balance shall be set manually or automatically to 3200K +/- 100 K.
C The test chart shall be shot by the camera so that the frame limited by the arrows
exactly coincides with the edges of the picture displayed on the monitor
underscan mode.
D The focus control shall be in auto or manual mode and shall be in best focus.
E The iris control shall be in auto or manual mode.
F Gain control shall be set to “0 dB”.
G Optical filter if any shall be set to “open” position.
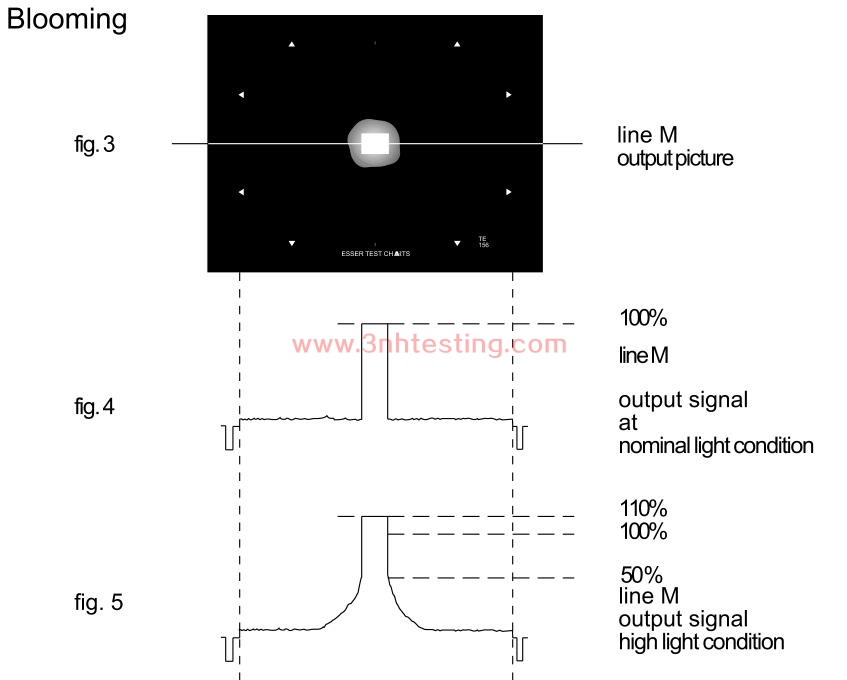
Blooming
Blooming occurs, when pixel of a CCD are intensively illuminated, so that the number of
generated electrons is higher than the storage capacity. The excess of electrons can
be spread into neighbouring cells. As a result the highlight areas of the scene appear
on the TV screen with an increase in size.
Characteristic to be specified
The ratio between the subject illumination producing the blooming and that corresponding
to the rated output signal level, that is the over-exposure above the nominal illumination.
The output signal shall be measured by an oscilloscope.
Two measurements shall be made as explained below
A. The line M (fig. 3) shall be selected on the oscilloscope. Reduce the light of the
illuminator as far that the amplitude of the signal (SB), due to blooming, is 50% of
the white signal (fig. 5). The light density shall be noted.
B. The light density of the illuminator should be increased until the signal amplitude
goes down to the nominal level, that is 100% of the rated luminance level (fig. 4).
The resulting light density shall be noted.
C. The ratio between the maximum illumination providing signal (SB) of 50% and
that corresponding to the 100% white level shall be defined by the ratio regarding
the light densities, given by the formula:
Over exposure = illumination for 50% of blooming / illumination for 100% signal level
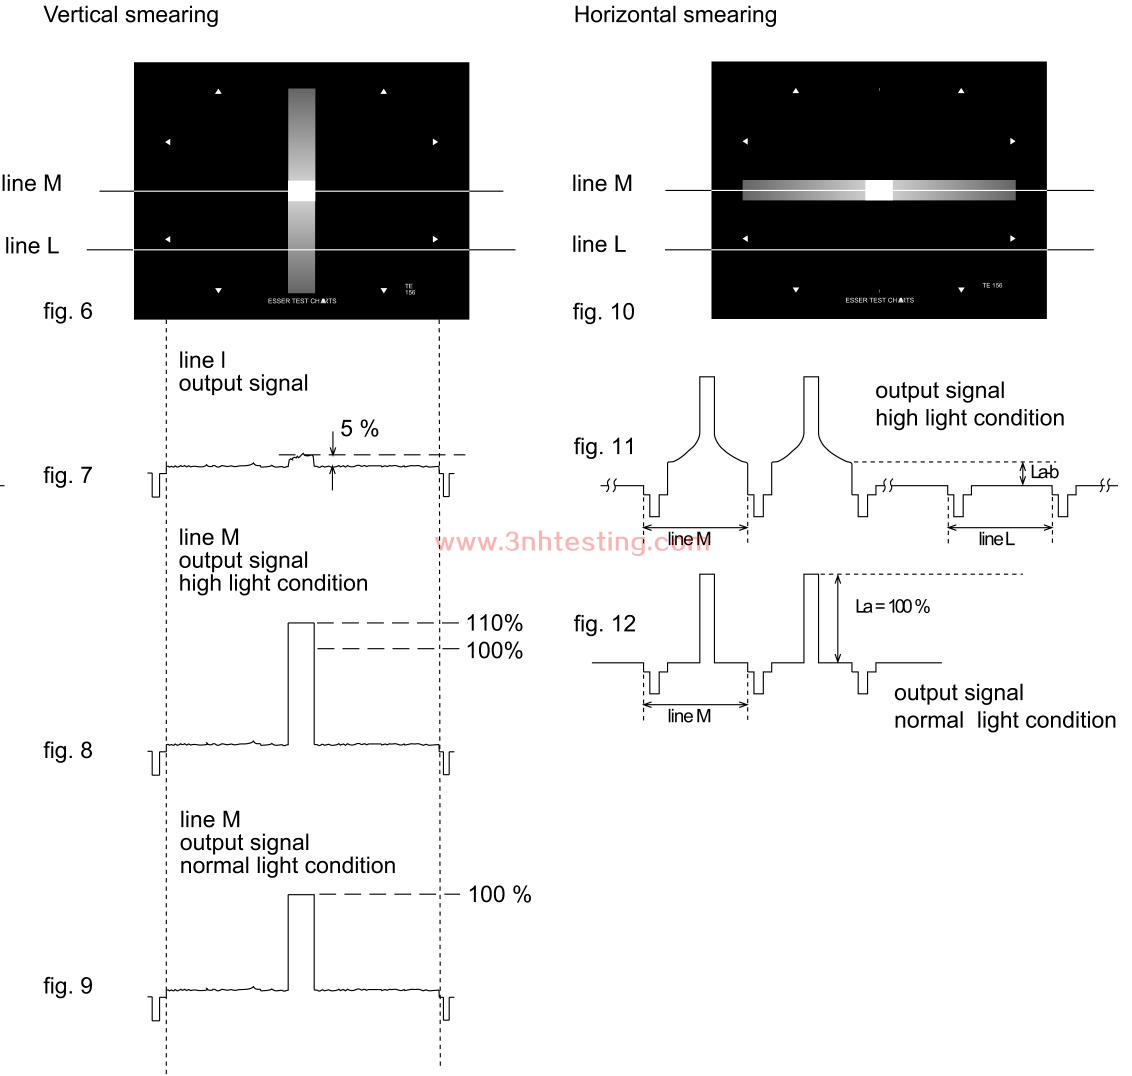
Smearing
Smearing occurs, when a small area of the solid state image sensor is strongly
illuminated which provides on the picture a vertical or horizontal bar passing through
this area (see fig 7 and 10).
Characteristics to be specified
The ratio between the subject illumination producing the smear and that corresponding
to the nominal level of the output signal.
Method of measurement
The equipment arrangement and the test chart shall be as shown in fig. 2.
Method of measurement of vertical smearing
1. The output signal shall be measured by an oscilloscope. Two measurements
shall be made as explained below:
a) The line L (fig. 6) shall be selected on the oscilloscope. The light density filter
shall be reduced so far that the amplitude of the signal due to smearing
becomes 50% of the 100% white signal (fig. 7). The resulting light density
shall be noted.
b) The line M (fig. 6) shall be selected on the oscilloscope. The light density
of the illuminator shall be reduced as far to provide rated signal level, that
is 100% white level (fig. 8 and 9). The resulting light density shall be noted.
2. The ratio between the maximum illumination providing smearing signal of
5% and that corresponding to provide the rated signal level shall be
calculated be the following formula:
Vertical smearing ratio = illumination for 5% smearing level/ illumination for 100% signal level
Method of measurement of horizontal smearing
1. The output signal shall be measured by an oscilloscope. Two measurements
shall be made as explained below:
a) The lines L and M shall be selected on the oscilloscope as in fig. 10. The light
density of the illuminator shall be reduced as far so that the level difference
(La-b in fig. 11) due to horizontal smearing becomes 5% of the rated output level,
that is 100% white signal level. The resulting light density shall be noted.
b) The light density of the illuminator shall be reduced as far to provide the rated signal
level La (in fig. 12) that is 100% white level. The resulting light density shall be noted.
2. The ratio between the maximum illumination providing smearing signal of 5% and that
corresponding to provide the rated signal level shall be calculated be the following formula:
Horizontal smearing ratio = illumination for 5% smearing level/ illumination for 100% signal level
Note: In case there is no possibility to adjust the light density of the illuminator, ND filter
shall be put in front of the camera. It shall be selected in such a way that the signal levels
described above shall be attained. The density D of the ND filter, which attains the second
signal level each, gives the result of the blooming and smearing ratios: 10 D
News
- 2017-03-31 sales elite awards n the first quar ...
- 2014-06-26 3nh Products Have Got CE Certificat ...
- 2014-06-12 Integrating Sphere
- 2024-03-08 New company name Guangdong ThreeNH ...
- 2014-06-12 NH Series High-Quality Colorimeter
- 2014-06-12 The Color of Objects
- 2014-06-30 NS800 Spectrophotometer CE Certific ...
- 2014-06-12 CIE Standard Observers
