.png)


FREQUENCY RESPONSE TEST CHART
- Introduction
- Product Software
FREQUENCY RESPONSE TEST CHART
REFLECTANCE

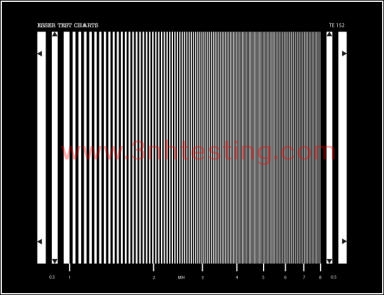
The test chart shows line rasters over the whole image area ranging from 1 to 8 MHz.
Below the line rasters (in the black surrounding area) there are line markings with the
respective MHz figures. The bars on the left and right sides of the picture (2 black and
white cycles on each side) have a frequency of 0.5 MHz and serve as reference value.
The width of the line rasters decreases step by step, however not within the black and
white cycles. Between two MHz cycles white whole numbers the bar width decreases
in 20 regular steps.
With help of an oscilloscope the frequency response of a camera can be checked. For
this purpose it may be useful to take into the camera picture the MHz marks outside the
actual test chart picture.
News
- 2014-06-12 Integrating Sphere
- 2014-06-26 3nh ISO9001 Certificate
- 2017-07-08 How to use SFR resolution test char ...
- 2015-05-08 3nh Products FCC Certificate
- 2014-06-12 Color Fastness
- 2014-06-12 What is a colorimeter?
- 2017-03-31 sales elite awards n the first quar ...
- 2014-06-12 ISO 12233 RESOLUTION TEST CHART
