.png)


.jpg)
UNIVERSAL TEST CHART FOR SCANNERS
- Introduction
- Product Software
UNIVERSAL TEST CHART FOR SCANNERS
REFLECTANCE
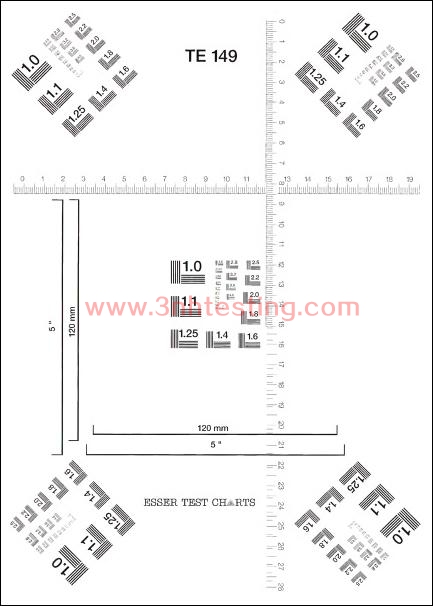
The test chart can be supplied as a foil or a reflectance chart, alternatively positive (see fig.)
or negative. The foil is available on 0.10 or 0.18 mm thickness. Image end external size is
297 x 210 mm (DIN A4).
The test chart is composed of
x 5 test arrays with ISO test pattern no. 2
y horizontal an vertical mm measuring scale of 19 resp. 28 cm length
z each two horizontal and vertical length marking of 120 mm and 5''
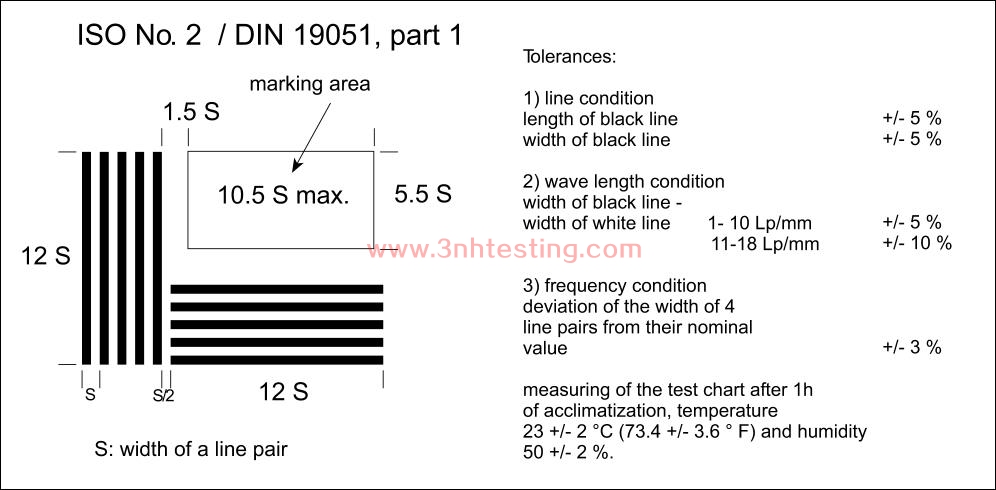
The ISO test pattern no. 2 consists of 26 groups of 2 x 5 line pairs which are arranged at
right angle to each other. The line pairs have a nominal value of 1.0 to 18 lp/mm. The
nominal value increases by factor 1.225 ( 6 2 ) from one group to the other, i.e. the lp/mm
value doubles after each 6 groups.
The test chart fulfills the three conditions that are given in ISO/DIN 19051 (see box above)*.
The test pattern is designed for assessment of the image quality of scanning devices.
Note: The line pairs with the width S can be equated to the local frequencies with the
wavelength λ = S according to the transmisson gamma. The measured limit of the local
frequencies allows the determination of a characteristic value for the resolution power
(in lp/mm) for a micro image.
The length marking of 120 mm resp. 5'' are used to check reduction ratio selected for the
image. The horizontal and vertical mm scale serves for checking the uniformity of the
scanning process.
Densities of the test chart are:
transparent test foil:transparent image areas 0.04; black image areas > 3.0
reflectance test chart:picture white 0.07, black 1.6
* On the test chart TE149 the ISO test pattern shows the following deviations (within the
allowable tolerance): The length of the bars is 11.75 S. The marking group “1.25” exceeds
the maximum width of 10.5 S.
News
- 2014-06-12 ISO 12233 RESOLUTION TEST CHART
- 2014-06-12 Colorimeters Versus Spectrophotomet ...
- 2015-05-08 PANTONE CU Color Card (Electronic E ...
- 2014-06-12 Pantone TPX 2012 (175 New Colors)
- 2014-06-12 What is a colorimeter?
- 2014-06-12 Integrating Sphere
- 2014-06-26 3nh ISO9001 Certificate
- 2014-06-12 CIE Standard Observers
