.png)


.jpg)
UER/EBU UNIVERSAL FILM TEST CHART
- Introduction
- Product Software
UER/EBU UNIVERSAL FILM TEST CHART
TRANSPARENCY
(in accordance with E.B.U. Document Tech. 3087 , 2nd edition)
Checking color and neutral gray reproduction, relative modulation depth, gradation and granularity of film material for television.
Data
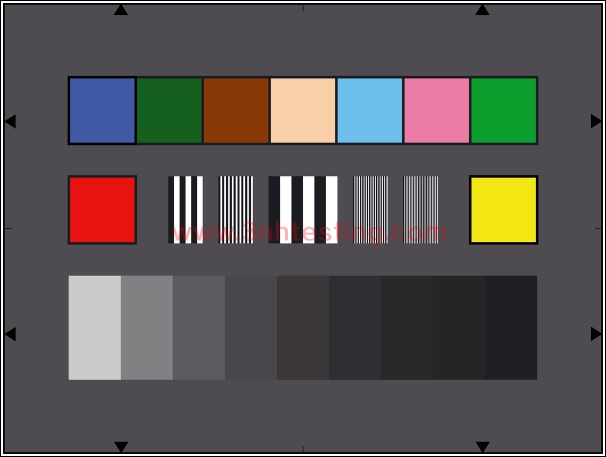
On a neutral gray background with a density of D=0.75 three groups of test components are arranged within the picture-relevant area.
These are:
• Nine test colors, which are selection of those contained in the Macbeth Color Rendition Chart “ColorChecker”, are arranged in
the upper area of the test chart:
4 saturated primary colors (blue, green, red and yellow) and 5 familiar colors of particular importance with a spectral reflectance
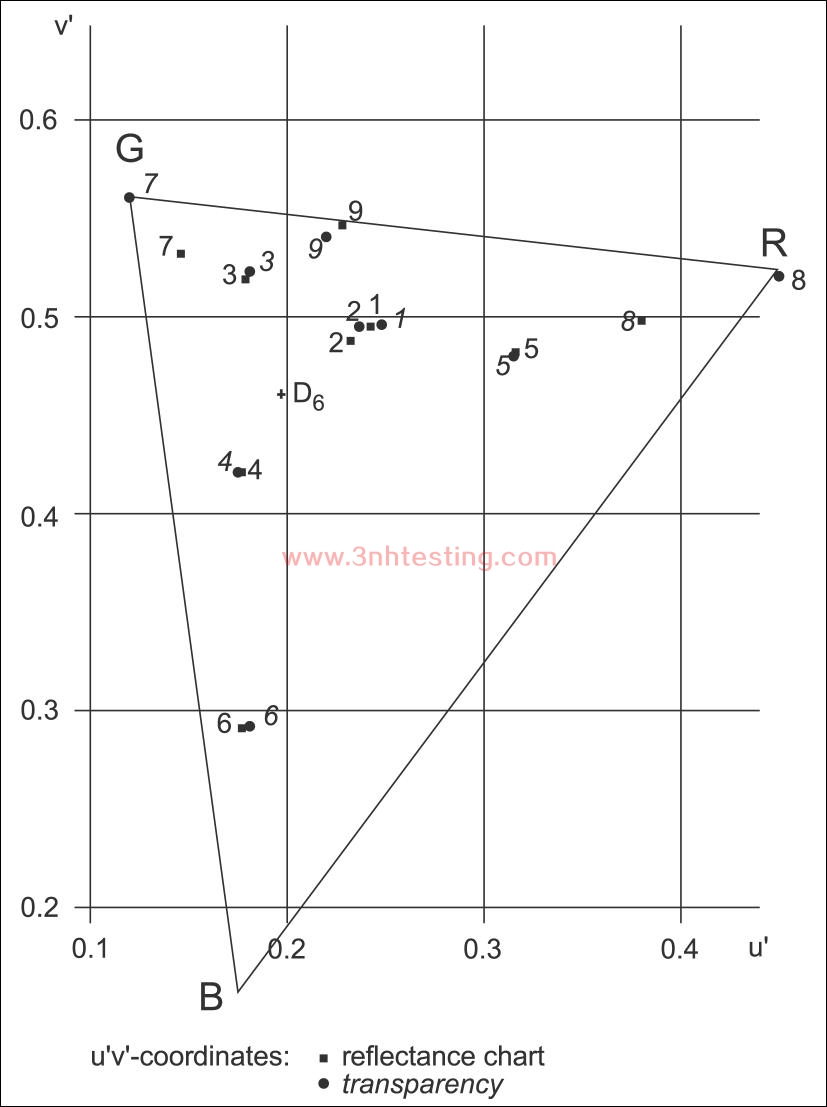
which represent the average of dark and light skin-tone, foliage, blue sky and moderate red. The diagram on page 3 shows the
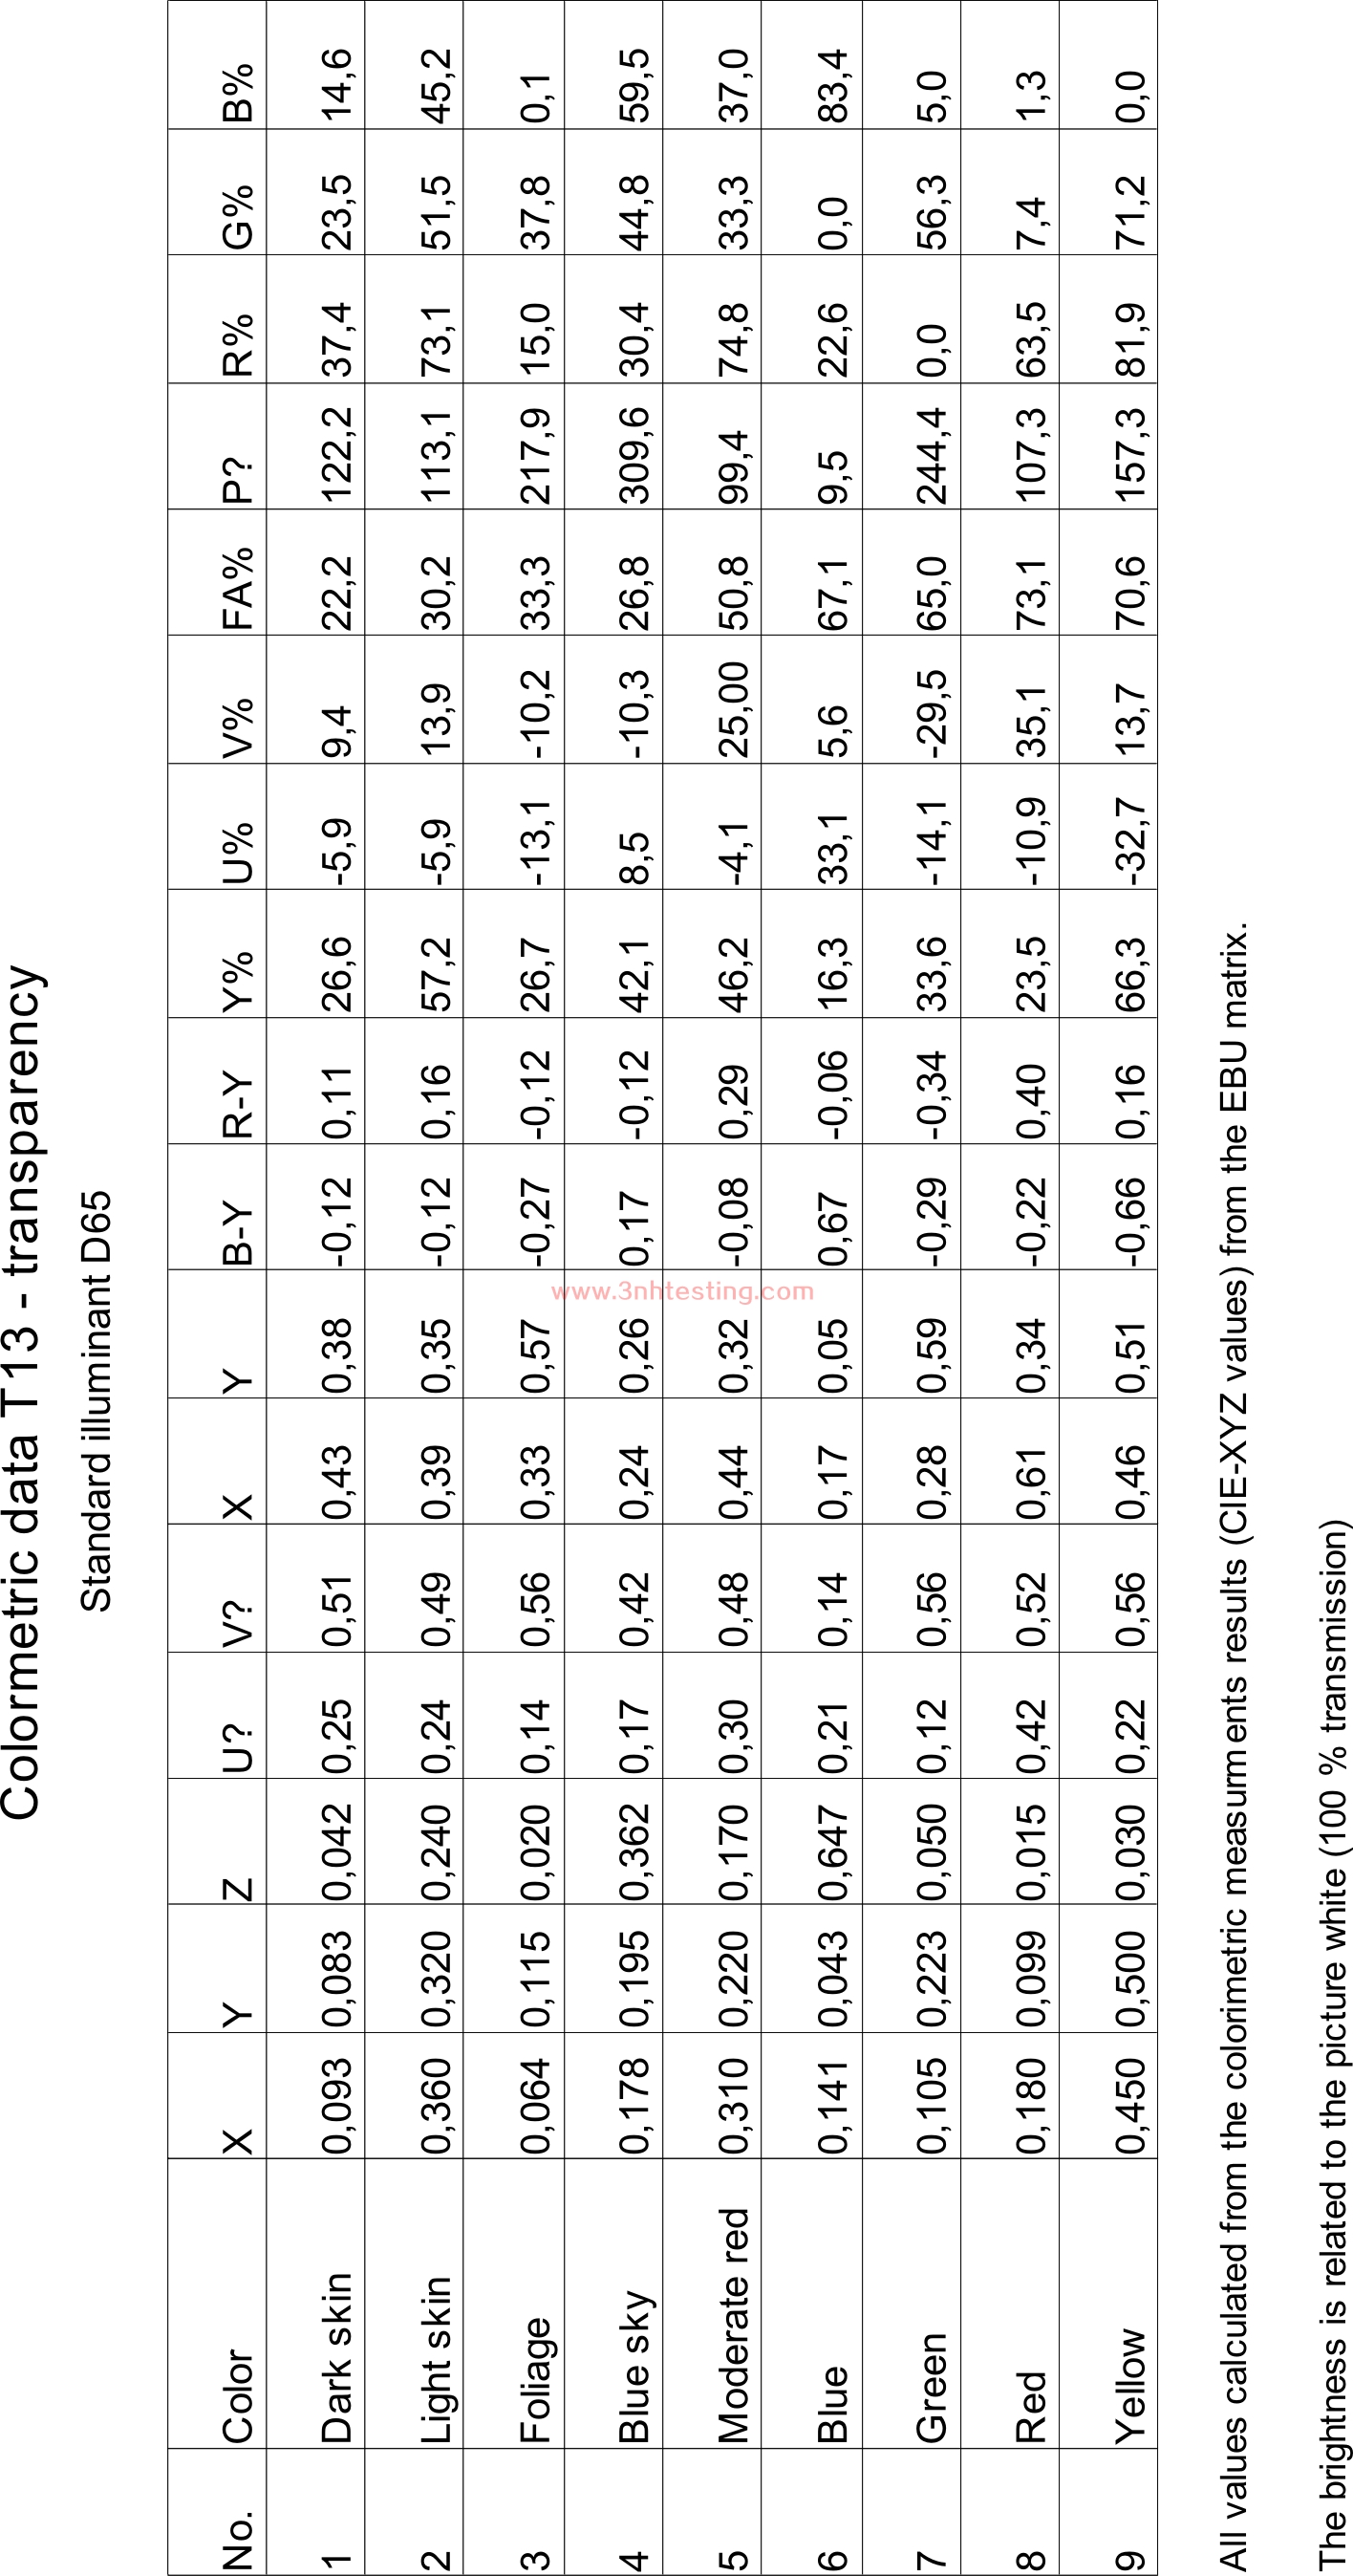
coordinates of the colors 1 to 9 with light D65 in the u'v'color diagram of 1976. The table on page 4 indicates the names of the test
colors and their respective Munsell notation.
• In the center area groups of vertical black and white bars with varying spatial distribution are arranged. They correspond to the
following frequencies (from left to right): 1, 3, 0.5, 5 and 7 MHz.*
• In the lower area a 9-step neutral gray scale is located with densities varying from D=0.2 (60% reflectance white ) to D= 1.8
(1.5% reflectance, black) by equal density increases of ∆D = 0.2 from left to right. With a uniform illumination the resultant
contrast range of the gray scale is thus 40:1.
Utilization
The universal film test chart was designed mainly for comparison and appraisal of films under operational conditions. It enables
measurements of the most important characteristics of film materials especially intended for color television (as are density, granularity,
resolution and color rendition).
Measurement evaluations of the multiple quality parameters are effected - after filming the test chart on the film material to test and after
correct processing - with the film measuring device (as specified e.g. in the “Technical specifications no 12/10”). The gray scale serves for
determining the gradation of the characteristic curve of the film, neutral gray rendition and granularity. The groups of vertical lines allow
an assessment of the frequency response of the modulation depth. Here the reference value is the modulation depth of the 0.5 MHz raster.
The test colors are used for checking the color rendition characteristics of the film material.
Furthermore the test chart can be used for matching film scanners. For this purpose the test chart has to be filmed on the film material in
use. After film processing this representative color picture has to be spliced into the tape leader. This mainly facilitates the matching procedure
of several scanners running simultaneously. (s. “Technical specifications... no. 12/7”, pictures 148/149).
In addition the universal film test chart allows rapid visual appraisal of the color rendition characteristics of electronic color television cameras.
Important
The reflectance chart should be lighted from both sides at an angle of 45°in order to minimize glossy effects. To delay the inevitable
fading of the colors ultra- violet rays should be kept off and the test chart should be covered after use.
*Frequency data refer to the 625-line television standard
- Previous:UER/EBU UNIVERSAL FILM TEST CHART
Next: ZONE PLATE TEST CHAR品T
News
- 2014-06-26 3nh ISO9001 Certificate
- 2015-05-08 3nh Products FCC Certificate
- 2014-06-12 Color Fastness
- 2024-03-08 New company name Guangdong ThreeNH ...
- 2017-03-31 sales elite awards n the first quar ...
- 2014-06-12 CIE Standard Observers
- 2014-06-30 NS800 Spectrophotometer CE Certific ...
- 2017-11-08 Attention before using T90-7 camera ...
