.png)


4K (UHD TV) Universal test chart
- Introduction
- Product Software
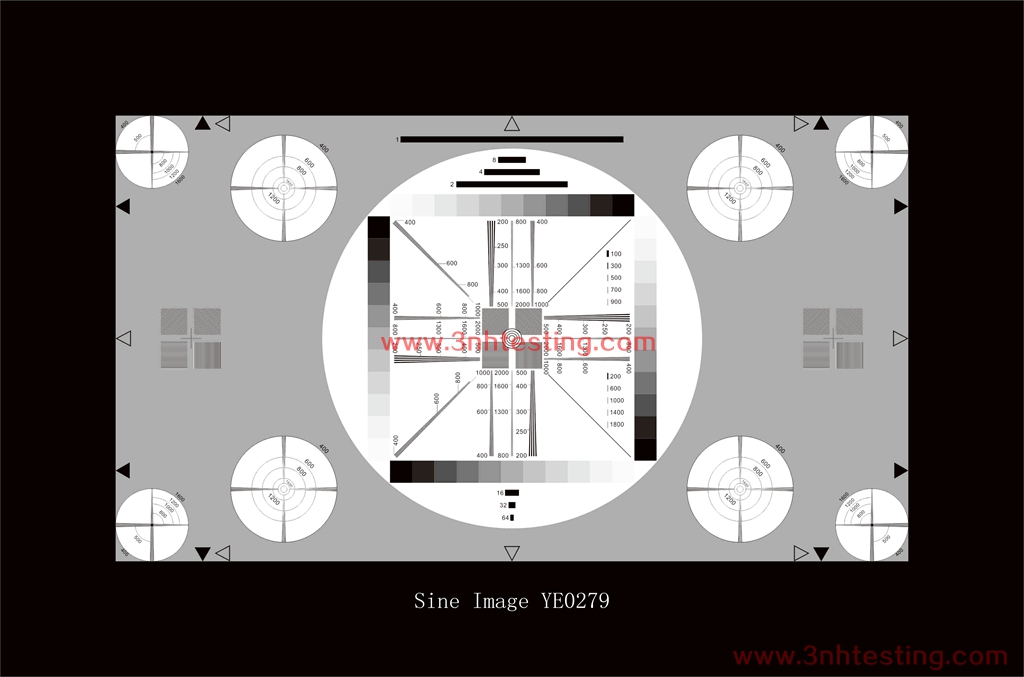
4K(UHD TV)UNIVERSAL TEST CHART 16:9
TRANSPARENT
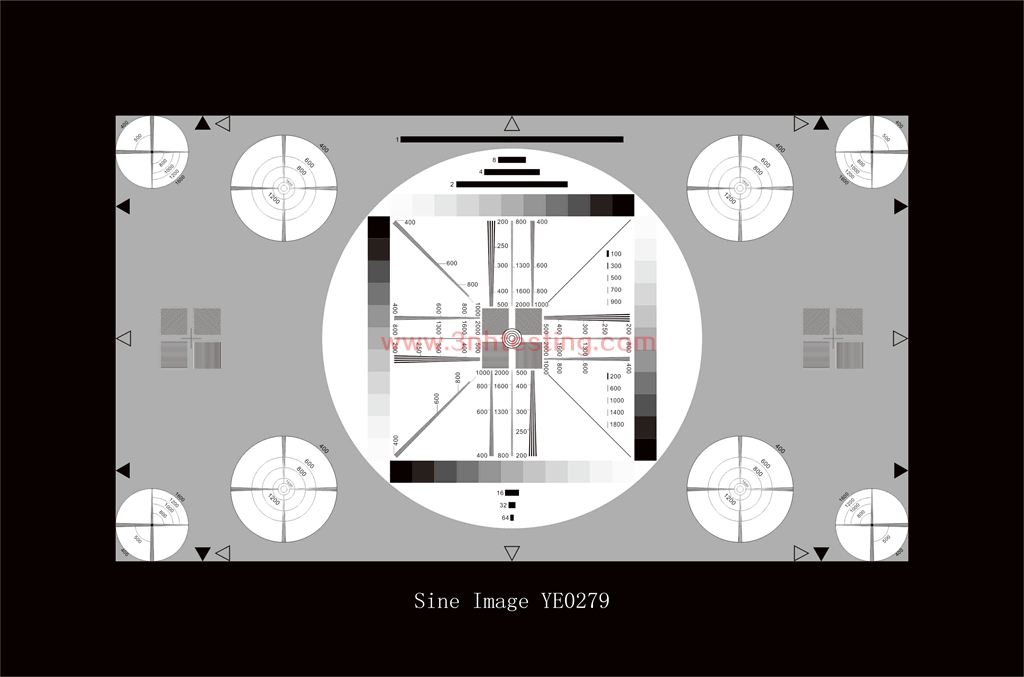
The YE0279 is desgned for quick(mainky visual) appraisal of 4K(UHD TV) cameras.
In the center of the test chart on a gray background(D=0.75;transmission=18%)a white circle with gray sacales and resolution wedgrs is cocated.On both sides of this central circle four circles with resolution wedges are arranged.
The 16:9 format is marked by four arrows lacated on the horizontal and vertical central lines.In addition,four arrows located close to the circles on the upper and the bottom edge of the piecure mark the 4:3 format.
The white central circles shows four gray scales each of 11 steps.They increase in equal lineat steps from D=0.15 to D=1.65 and are used for checking halftone rendition of cameras.De to the white surrounding area the results may.however,be qualified.
ALL frequency values in the test chart are indicated in cph(cycles per picture height).In the central circle three resolution wedges with different frequencies are arranged vertically and horizontally.They reach from 200 to 500,from 400 to 1000 and from 800 to 2000 cph.In addition,two resolution wedges angled in 45° generate frequencies of 400 to 1000 cph.
In the middle of the test chart and on the left and right sides there are four squares with line rasters that are inclined at angles of 0 degree,45 degree,90 degree and 135 deggree.They gene rate a frequency of 400 cph.Those line rasters which are inclined at angle of 45 degree and 135 degree generate a diffe rent frenquncy in horizontal and vertical direction(due to thear inclination)
The eight outer circles are arranged in such a way taht they can be uses both for 16:9 and 4:3 format.The larger ones show crooo-shaped
resolution wedges.The circular rings,which can also be used for checking geometry,are designed for making the resolution in vertical and horizantal direction.Resolution is shown at 400,600,800,1200 and 1600cph.The four
circles in the corners have longer resolution wedges.They cross at 640 cph and have marking for 400 to 1600 cph.
In the center of the test chart both in the gray and white area bar elements are arranged with a length of 1(=half the picture-height),2,4,8,16,32 and 64 cph.Left to right vertical gray scale there are five additional short bars with 100 to 900 and 200 to 1800 cph.
News
- 2014-06-12 Human Eyes to Distinguish Colors
- 2014-06-12 NH Series High-Quality Colorimeter
- 2017-03-31 sales elite awards n the first quar ...
- 2014-06-12 Colorimeters Versus Spectrophotomet ...
- 2015-05-08 PANTONE CU Color Card (Electronic E ...
- 2014-06-12 CIE Standard Observers
- 2014-06-12 ISO 12233 RESOLUTION TEST CHART
- 2014-06-26 3nh ISO9001 Certificate
