.png)


Multi Burst Test chart designed for resolution measurements, mainly for visual tests.
- Introduction
- Product Software
MULTI BURST TEST CHART (1 - 6 MHz)
REFLECTANCE
.jpg)
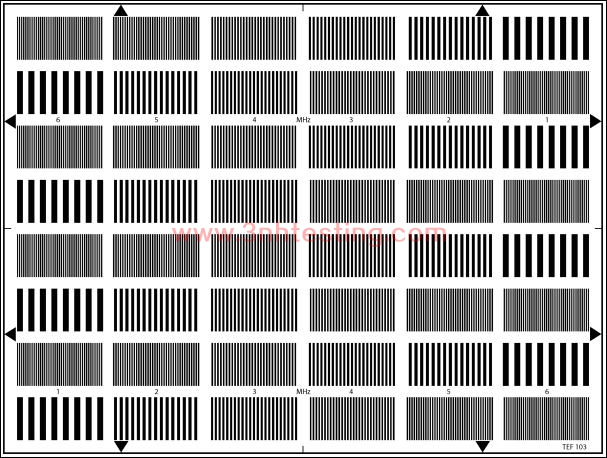
The test chart is designed for resolution measurements, mainly for visual tests.
The chart consists of 8 rows with each 6 fields of multiburst of frequencies from 1 to 6 MHz
The order of fields is switched in every second row. Only a limited depth of modulation measurement
is possible because there is no 0.5 MHz reference on the chart. You can use the 1 MHz as a reference
but be aware, that the result is not comparable with usual measurements with e.g. T03, T07, TE99
and TE 07. But there are more fields with different frequencies better distributed over the picture area
compared to e.g. the T07, TE99 and TE107.
Measuring equipment: video oscilloscope, preferably with memory function.
Measuring conditions: The camera settings must be as follows
Shading correction: On
Aperture correction: OF
Gamma correction: OFF
Contour correction: OFF
Color correction: OFF
Iris: F/5.6 for 2/3” CCD, F/4 for 1/2” CCD
The test chart is evenly illuminated so that for the frequency burst at 1 MHz the amplitude of the video
signal at the output of the correctly positioned and focussed camera is 0% (0V) for the black bars and
100% (700mV/ 75 Ohms) for the white bars. Care must be taken to avoid clipping of the signal to be
measured at the black and white level.
Measurement procedures
Measurements can be made on the various camera output signals, but preferably on the Y luminance
signal (or coded Y with perfect B and W balance). The measurement is made at the center of the
image and at the corners so that account is taken of lateral chromatic aberration of the lens. In addition
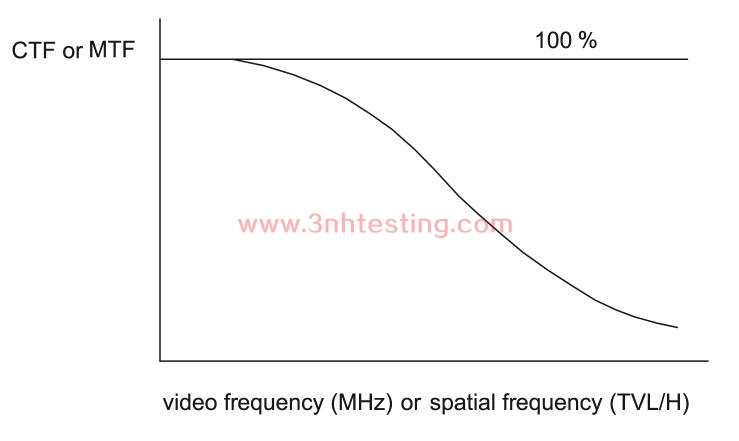
to determining camera response to the particular value of 5 MHz, measurement of the response at
the other frequencies serves to plot a curve giving contrast loss according to the spatial frequency
of the test chart. Frequency bursts of 1MHz and 2 to 6 MHz are recommended for this measurement.
The measurements give the contrast loss of the camera response at the value of 2 to 6 MHz. The
obtained response is a contrast transfer function (CTF).
Mathematical relations can be used to calculate the MTF according to the CTF values:
MTF(N)= π/4[CTF(N) + 1/3 CTF(3N) - 1/5 CTF(5N) + 1/7 CTF(7N) - 1/9 CTF(9N) + 1/11 CTF(11N)...]
where N is spatial frequency of the test chart analysed; N in TVL/H
News
- 2014-06-12 Colorimeters Versus Spectrophotomet ...
- 2014-06-12 ISO 12233 RESOLUTION TEST CHART
- 2024-04-29 New Guangdong ThreeNH bank account
- 2024-03-08 New company name Guangdong ThreeNH ...
- 2014-06-12 Color Fastness
- 2015-05-08 3nh Products FCC Certificate
- 2017-07-08 How to use SFR resolution test char ...
- 2014-06-30 NS800 Spectrophotometer CE Certific ...
