.png)


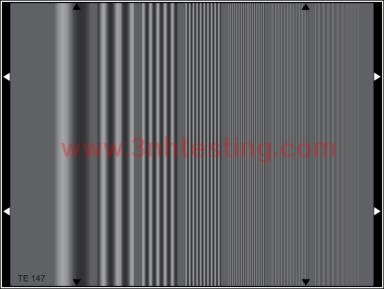
TEST SIGNAL TC . LINE 18 WITH 0.2 MHZ
- Introduction
- Product Software
TEST SIGNAL TC . LINE 18 WITH 0.2 MHZ
REFLECTANCE

The TE147 reproduces the test signal, line 18, as specified in CCIR recommendation 473.
With the aid of measuring instruments test signals can be evaluated in a simple, and partly
automatic way.
Approximate values of the frequency response of the amplitude (amplitude frequency
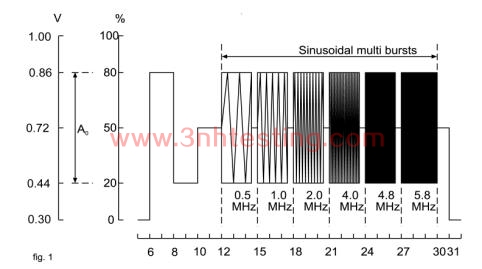
characteristic) can be determined with the test signal, line 18, the so-called multi burst signal.
This signal is composed of a reference signal of 420 mV (60%) amplitude (A0) and 6
frequency bursts with frequencies of 0.5; 1.0; 2.0; 4.0; 4.8 and 5.8 MHz which also show
nominal amplitudes of 420 mV (peak-to-peak) (s.fig.1).
According to CCIR recommendation 569 test signal evaluation devices should either indicate
the amplitude errors of the signal frequency bursts or the maximum deviation of the amplitude
of the multi burst signal.
a)Amplitude errors of individual frequency bursts
The amplitude errors of an individual frequency burst is defined as the difference between the
amplitude of the respective frequency burst (A0.5; A1.0; ... ; A5.8 in fig.1) and the amplitude.
Errors are indicated separately for each of the six multi bursts.
b)Maximum deviation of the amplitudes
First two quantities x and y are determined. They are defined as follows:
x = (Amax – A0) / A0 * 100(%)
y = (Amin – A0) / A0 * 100(%)
with the following denotations (fig. 1):
A0 = Amplitude of reference signal
Amax = Amplitude of frequency burst with maximum amplitude
Amin = Amplitude of frequency burst with minimum amplitudes
The maximum deviation of amplitudemax is the higher of the two values x resp. y, i.e.
max = x (%), if x > y max = -y (%), if y > x
Note: CCIR recommendation 569 determines that the amplitudes of the individual frequency
bursts (A0.5; A1.0; ... ; A5.8) are each to be measured in the temporal middle of the burst.
News
- 2014-06-30 NS800 Spectrophotometer CE Certific ...
- 2014-06-12 NH Series High-Quality Colorimeter
- 2017-06-27 Definition and formation of pixel n ...
- 2014-06-12 3nh Innovation from Products to Mar ...
- 2015-05-08 3nh Products FCC Certificate
- 2014-06-26 3nh TUV Certificate
- 2017-03-31 sales elite awards n the first quar ...
- 2014-06-26 3nh ISO9001 Certificate
