.png)


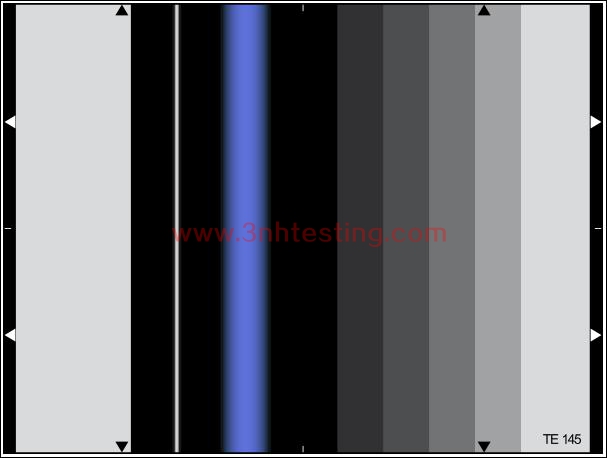
TEST SIGNAL TEST CHART – LINE 17
- Introduction
- Product Software
TEST SIGNAL TEST CHART – LINE 17
TRANSPARENCY

The TE145 is designed for measuring several signal parameters according to the definitions
set in CCIR Recommendation 569.
For measurement test signal analysers of different manufactures are available on the
market. The data sheet restricts itself on an enumeration of the signal parameters and their
short definition.
1. Amplitude of white pulse
is defined as the difference of the signal level in the middle of the white pulse and the black
level before the gray scale signal.
.jpg)
2. Slope of the white pulse
is defined as the difference between the signal level of the white pulse 1µs after the 50%
value of the leading edge and 1µs before the 50% value of the traveling edge.
3. Smoothing down the white pulse
is defined as the difference between the signal level of the white pulse, 0.4µs and 1 µs
after the 50% value of the leading edge.
4. Signal shaping of black signal (Streaking)
is defined as the difference between the levels 0.4 and 1µs after the 50% level of the
white trailing edge.
5. Baseline distortion
is defined as the difference between the white pulse level 0.4µs after the 50% value
of the white trailing edge and the black level 4µs before the start of the gray scale.
6. 2T pulse amplitude
is defined as the difference between the peak level of the 2T pulse and the black
4µs before the start of the gray scale.
7. 2T overshoot / subharmonic oscillations
With this measurement a possible existent first sub harmonic oscillation and a first
overshoot after the trailing edge of the 2T pulse should be recorded.
8. 2T pulse distortion
With this measurement it can be proved, if a 2T pulse distortion in relation to the
zero level fits in a defined tolerance scheme with a defined width. The 2T pulse
distortion, which even touches the scheme at any point, is described, by the width
of the scheme at +/- 800ns.
9. Amplitude of the 20T colour subcarrier (CSC)
is defined as the peak to peak value of the CSC proportion of the 20T pulse. The
deviation of the amplitude of CSC from the amplitude of the white pulse in % of the white
pulse amplitude has to be recorded.
10. Chrominace-luminance delay inequality
is defined as delay time t between the low frequent and the CSC frequent proportion of
the 20T pulse. The delay time luminance-chrominance has to be recorded in ns. It is
positive, if the symmetry axis of the CSC frequent portion of the 20T pulse occur later than
the symmetry axis of the lower frequent portion of the 20T pulse.
11. 20T intermodulation chrominance-luminance
is defined as the difference between the amplitude of the low frequent portion of the 20T
pulse and half the amplitude of the white pulse.
12. Luminance non-linearity
is defined as the difference of the biggest step (Lmax) and the smallest step (Lmin) of
the gray scale. The luminance non-linearity has to be reportetd as LNL = (Lmax – Lmin)
/ Lmax x 100(%)
13. Signal-to-noise-ratio (S/N ratio)
is defined as the ratio of the white pulse level to the effective value of bandwith limited
statistic noise in a particular line (mainly the vertical blanking) or a part of it. Normally
noise is measured in line 22 or in line 22 and 335.
14. Absolute running time
is defined as the time which the low frequent or the CSC portion of the 20T pulse needs
to run through the measuring object. The absolute running time has to be reported in ns.
News
- 2014-06-26 3nh Products Have Got CE Certificat ...
- 2017-03-31 sales elite awards n the first quar ...
- 2014-06-26 3nh ROHS Certificate
- 2014-06-12 The Color of Objects
- 2014-06-12 Integrating Sphere
- 2017-06-27 Definition and formation of pixel n ...
- 2024-04-29 New Guangdong ThreeNH bank account
- 2014-06-12 ISO 12233 RESOLUTION TEST CHART
