.png)


.jpg)
COLOR BAR TEST CHART 16:9
- Introduction
- Product Software
COLOR BAR TEST CHART 16:9
TRANSPARENCY
.jpg)
The test chart TE106 is designed for checking the color rendition of TV cameras.
The picture area is divided into 6 color bars showing the three primary colors red, green and blue
and the secondary colors cyan, yellow and purple; in addition there is one bar of white and black.
The succession from left to right - white, yellow cyan, green, purple, red and blue - corresponds to
that of an electronically generated color bar.
The test chart is adjusted to standard light D65. It can be used in an illuminator with fluorescent
tubes as the LG2. No matter which kind of light you are using, the camera has to be white balanced
to the white bar of the transparency first.
The colors of the transparency are close to the SMPTE standard colors of the electronic color bar
as far as chroma, saturation and luminance are concerned. Slight deviations from the standard
values can, however, not be avoided due to the color pigments of the filters available.
The spectral transmission values of the colors were measured by a spectrometer under standard
conditions. Then the CIE-XYZ values were calculated for standard illumination D65. The resulting
XYZ-values were mathematically transformed by the SMPTE-matrix and give the results shown
in the figure and the table on the following page.
Deviations of the test transparency color coordinates from the standard values are usually under
5%. The largest deviations are with blue, which has a too small color saturation. It has to be
noted that different measuring devices and methods may lead to significant deviations, i.e.
measuring errors of 5% are considered acceptable.
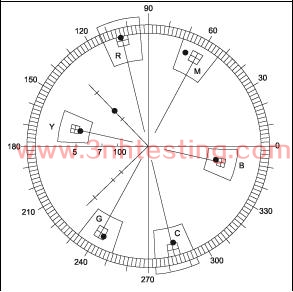
The figure on the right shows the calculated values of the colors as they should appear on a vectorscope.
Color Bar Test Chart – Colorimetric results
Compared with the SMPTE 100 / 7.5 / 75 / 7.5 Color Bar
|
Color |
|
|
RGB values |
|
|
Luminance |
Croma level |
Min. chroma |
Max. chroma |
Phase |
||||||||
|
|
|
|
|
|
|
|
(IRE) |
(IRE) |
Excursion |
Excursion |
(degrees) |
|||||||
|
|
|
|
|
|
|
|
|
|
|
|
|
(IRE) |
(IRE) |
|
|
|||
|
|
R% |
G% |
B% |
|
|
|
|
|
|
|
|
|
|
|
|
|||
|
|
SMPT |
|
SMPT |
106 |
SMPT |
106 |
SMPT |
|
106 |
SMPT |
106 |
SMPT |
|
106 |
SMPT |
106 |
SMPT |
106 |
|
|
106 |
|
|
|||||||||||||||
|
White |
100 |
100 |
100 |
100 |
100 |
100 |
100 |
|
100 |
|
|
|
|
|
|
|
|
|
|
Yellow |
75 |
72 |
75 |
73 |
0 |
0 |
69 |
|
66,7 |
62,1 |
61,9 |
37,9 |
|
37 |
100 |
96,4 |
167,1 |
168,8 |
|
Cyan |
0 |
0 |
75 |
76 |
75 |
81 |
56,1 |
|
57,1 |
87,7 |
91,3 |
12,3 |
|
11,5 |
100 |
102,7 |
283,5 |
284,6 |
|
Green |
0 |
0 |
75 |
79 |
0 |
0 |
48,2 |
|
50,2 |
81,9 |
85,9 |
7,3 |
|
7,2 |
89,2 |
93,1 |
240,7 |
243,2 |
|
Purple |
75 |
74 |
0 |
0 |
75 |
64 |
36,2 |
|
34,6 |
81,9 |
78,6 |
-4,8 |
|
-4,7 |
77,1 |
73,9 |
60,7 |
66,4 |
|
Red |
75 |
77 |
0 |
0 |
0 |
0 |
28,2 |
|
30,1 |
87,7 |
87,6 |
-15,6 |
|
-13,8 |
72,1 |
73,8 |
103,5 |
103,5 |
|
Blue |
0 |
0 |
0 |
0 |
75 |
59 |
15,4 |
|
13,6 |
62,1 |
48,2 |
-15,6 |
|
-10,5 |
46 |
37,8 |
347,1 |
347,1 |
- Previous:COLOR BAR TEST CHART 16:9
Next:MULTI BURST TEST CHART
News
- 2014-06-12 Integrating Sphere
- 2014-06-12 Pantone TPX 2012 (175 New Colors)
- 2017-11-08 Attention before using T90-7 camera ...
- 2024-04-29 New Guangdong ThreeNH bank account
- 2017-06-27 Definition and formation of pixel n ...
- 2014-06-12 ISO 12233 RESOLUTION TEST CHART
- 2014-06-30 NS800 Spectrophotometer CE Certific ...
- 2014-06-12 The Color of Objects
