.png)


CHESSBOARD TEST CHART
- Introduction
- Product Software
CHESSBOARD TEST CHART
REFLECTANCE
.jpg)
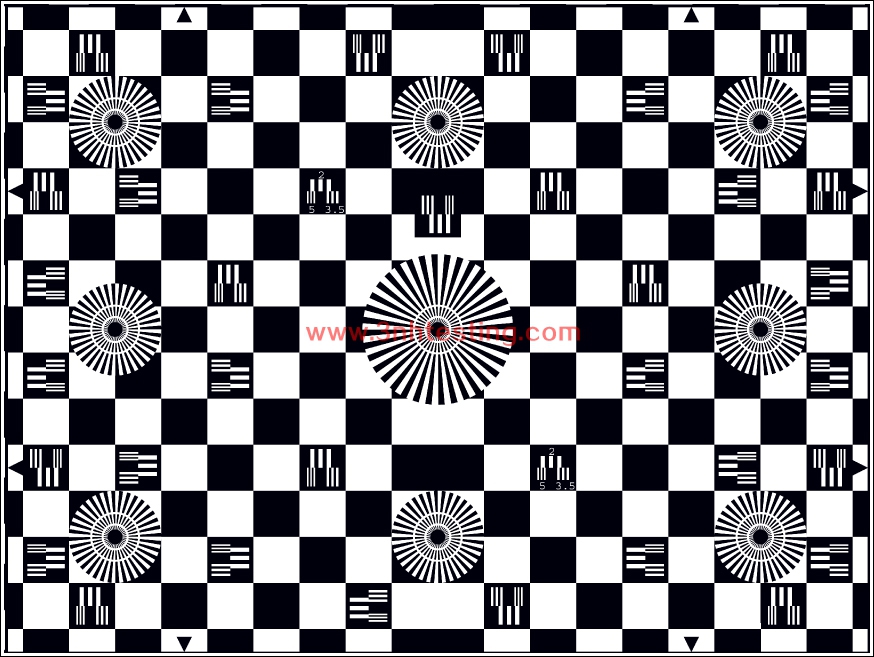
The Y06A test chart is designed for checking geometry and resolution.
DATA
Similar to a chessboard the test chart is composed of 13 x 18 black and white square fields which are surrounded by
rectangular at the edges that correspond to the 14/19 grid raster lines of electronic test generators. (The division of the
horizontal grid lines of these generators corresponds to 42 lines per complete picture.)
The inner circular lines of the nine sector stars mark a 625-line structure. The larger circular lines mark a structur of
312 lines. Horizontal resp. vertical line rasters are arranged in 33 white fields. They correspond to frequency raster
of 2, 3.5 and 5 MHz.
UTILIZATION
• Checking geometry and the congruency of raster, by means of an electronically generated grid, if necessary
• Checking the uniformity of the signal generation.
• Checking resolution and its distribution over the picture area.
• Checking back focal distance.
- Previous: CHESSBOARD TEST CHART
Next:MULTI BURST GRAY SCALE TEST CHART
News
- 2014-06-12 3nh Innovation from Products to Mar ...
- 2015-05-08 PANTONE CU Color Card (Electronic E ...
- 2024-03-08 New company name Guangdong ThreeNH ...
- 2014-06-26 3nh TUV Certificate
- 2014-06-12 CIE Standard Observers
- 2014-06-12 Pantone TPX 2012 (175 New Colors)
- 2014-06-12 What is a colorimeter?
- 2014-06-12 Color Fastness
