.png)


CERTIFICATE HIGH RESOLUTION TEST CHART
- Introduction
- Product Software
CERTIFICATE HIGH RESOLUTION TEST CHART
REFLECTIVE
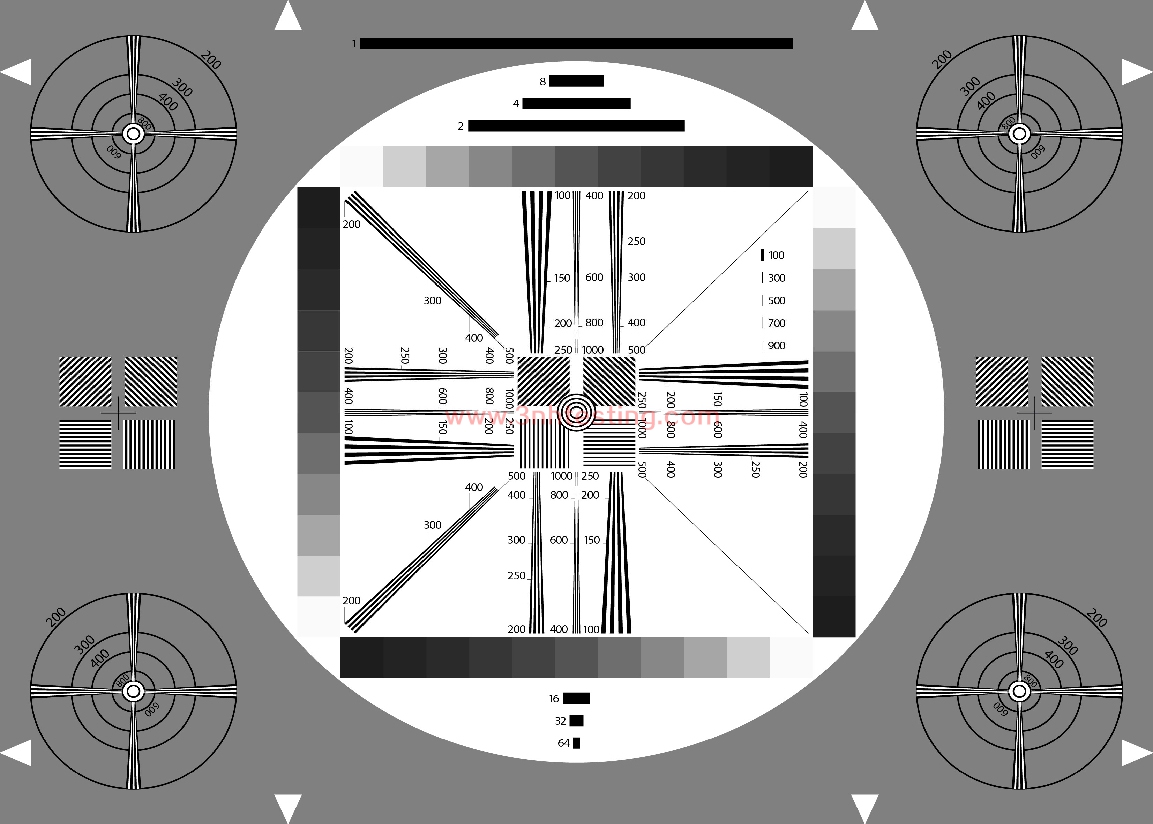
The YE97 corresponds to the 4:3 part of the HDTV test chart TE117. It is designed for measuring and
quick (most visual) appraisal of transmission characteristics of high resolution non-broadcast cameras.
In the center of the test chart on a gray background (D=0.75; reflectance = 18%) a white circle with four
gray scales of 11 steps each is located. They are graduated in equal linear steps from D=0.15 to D=1.65
and are used for checking halftone rendition of cameras. Due to the white surrounding area the results may,
however, be qualified.
On both sides of this central circle four circles with resolution wedges are arranged.
All frequency values in the test chart are indicated in cph (cycles per height). In the central circle three
resolution wedges with different frequencies are arranged vertically and horizontally. They reach from 100 to
250, from 200 to 500 and from 400 to 1000 cph. In addition, two resolution wedges angled in 45° generate
frequencies of 200 to 500 cph.
In the middle of the test chart and on the left and right sides there are four squares with multi bursts that are
inclined at angles of 0°, 45°, 90° and 135 ° generate a different frequency (141.4 cph) in horizontal and vertical
direction (due to their inclination). The inner white and the four outer circles enable a rough appraisal of the scan
linearity. The outer ones show cross-shaped resolution wedges. The circular rings, which can also be used for
checking geometry, are designed for marking the resolution in vertical and horizontal direction. Resolution is
shown at 200, 300, 400, 600 and 800 cph.
In the center of the test chart both in the gray and the white area bar elements are arranged with a length of
1 (= half the picture-height), 2, 4, 8, 16, 32 and 64 cph. Left of the right vertical gray scale there are five additional
short bars with 100, 300, 500, 700 and 900 cph.
- Previous:ITE APERTURE RESPONSE CHART
Next:ITE HIGH REGISTRATION CHART
News
- 2024-03-08 New company name Guangdong ThreeNH ...
- 2014-06-12 Colorimeters Versus Spectrophotomet ...
- 2014-06-26 3nh TUV Certificate
- 2014-06-12 ISO 12233 RESOLUTION TEST CHART
- 2014-06-30 NS800 Spectrophotometer CE Certific ...
- 2014-06-12 The Color of Objects
- 2017-06-27 Definition and formation of pixel n ...
- 2014-06-12 3nh Innovation from Products to Mar ...
